
Advanced Search

Advanced Search

Current Filters

Filter your query

Publication Types

Other

to

How Prices for the First 10 Drugs Up for U.S. Medicare Price Negotiations Compare Internationally

Image, view of pharmacy with people outside

View of a Paris drugstore on June 29, 2019. Americans pay more for brand-name prescription medications than do residents of most other countries, with per capita spending on pharmaceuticals nearly three times the average of the other member nations of the Organisation for Economic Co-operation and Development (OECD). Photo: Edward Berthelot/Getty Images

View of a Paris drugstore on June 29, 2019. Americans pay more for brand-name prescription medications than do residents of most other countries, with per capita spending on pharmaceuticals nearly three times the average of the other member nations of the Organisation for Economic Co-operation and Development (OECD). Photo: Edward Berthelot/Getty Images

Toplines
  • Prices for 10 drugs commonly prescribed for millions of older Americans are, on average, three times higher than prices in other high-income countries

  • Even after price rebates and discounts, Americans pay significantly more for brand-name drugs than people in most other countries — leaving room for further reductions in upcoming Medicare drug price negotiations

Americans pay more for brand-name prescription medications than do residents of most other countries, with per capita spending on pharmaceuticals nearly three times the average of other member nations of the Organisation for Economic Co-operation and Development (OECD).1 In 2022, high costs forced one of five U.S. adults age 65 and older to skip or delay filling a prescription, miss or reduce doses, or use someone else’s medication.2 More than half of patients resort to cost-coping strategies like coupons or free samples so they can get the medications they need but cannot afford.3 Such stopgap measures can have particularly serious consequences for older people who rely on medications to control chronic health conditions.4

The 2022 Inflation Reduction Act (IRA) has empowered the Centers for Medicare and Medicaid Services (CMS), for the first time, to negotiate prices on behalf of Medicare for a small group of prescription drugs. Negotiations for the first 10 drugs will begin in February 2024, with price changes taking effect in 2026. This will increase to 15 additional Medicare Part D drugs in 2027, up to 15 Parts B and D drugs in 2028, and up to 20 drugs in subsequent years.5 These price negotiations are projected to save the government $100 billion through 2031, savings that will go in part toward funding an important but costly provision of the IRA that caps Medicare beneficiary spending for Part D drugs at $2,000 per year, starting in 2025.6

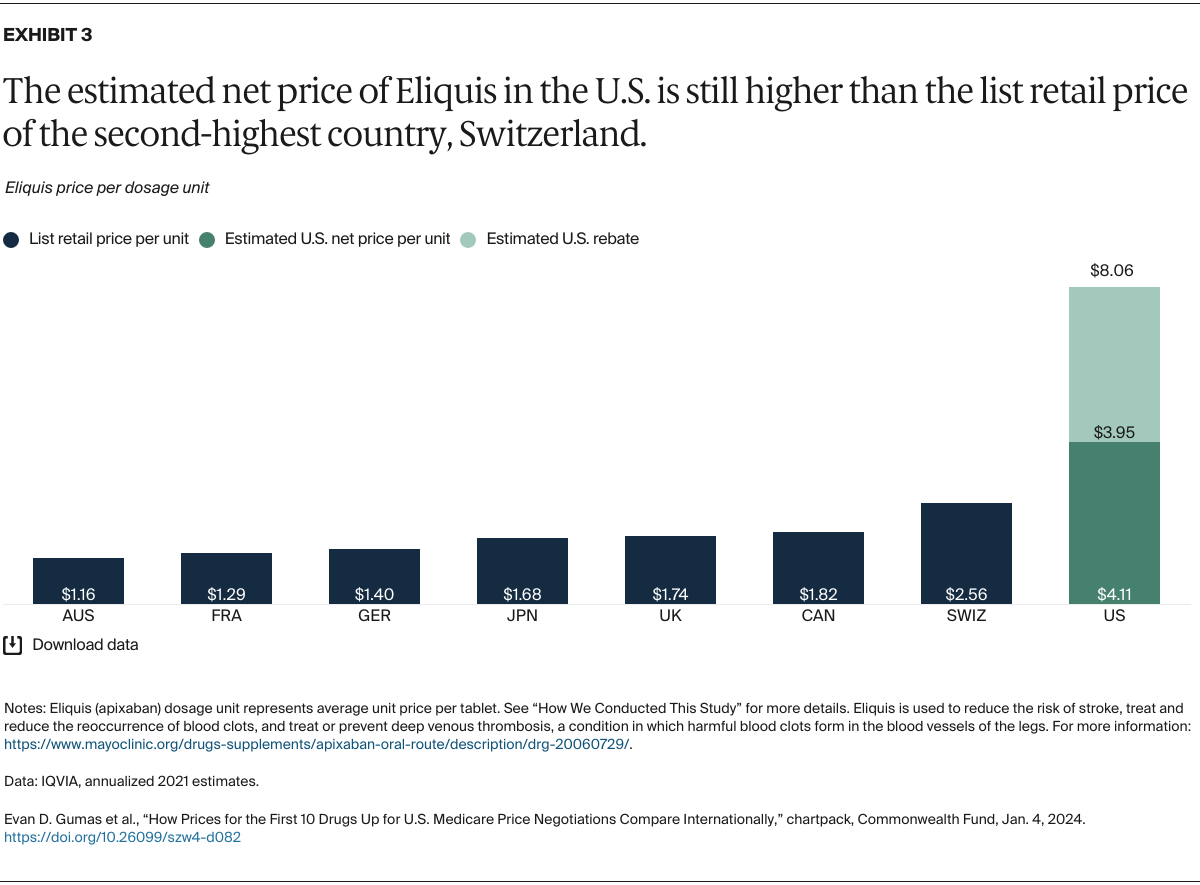
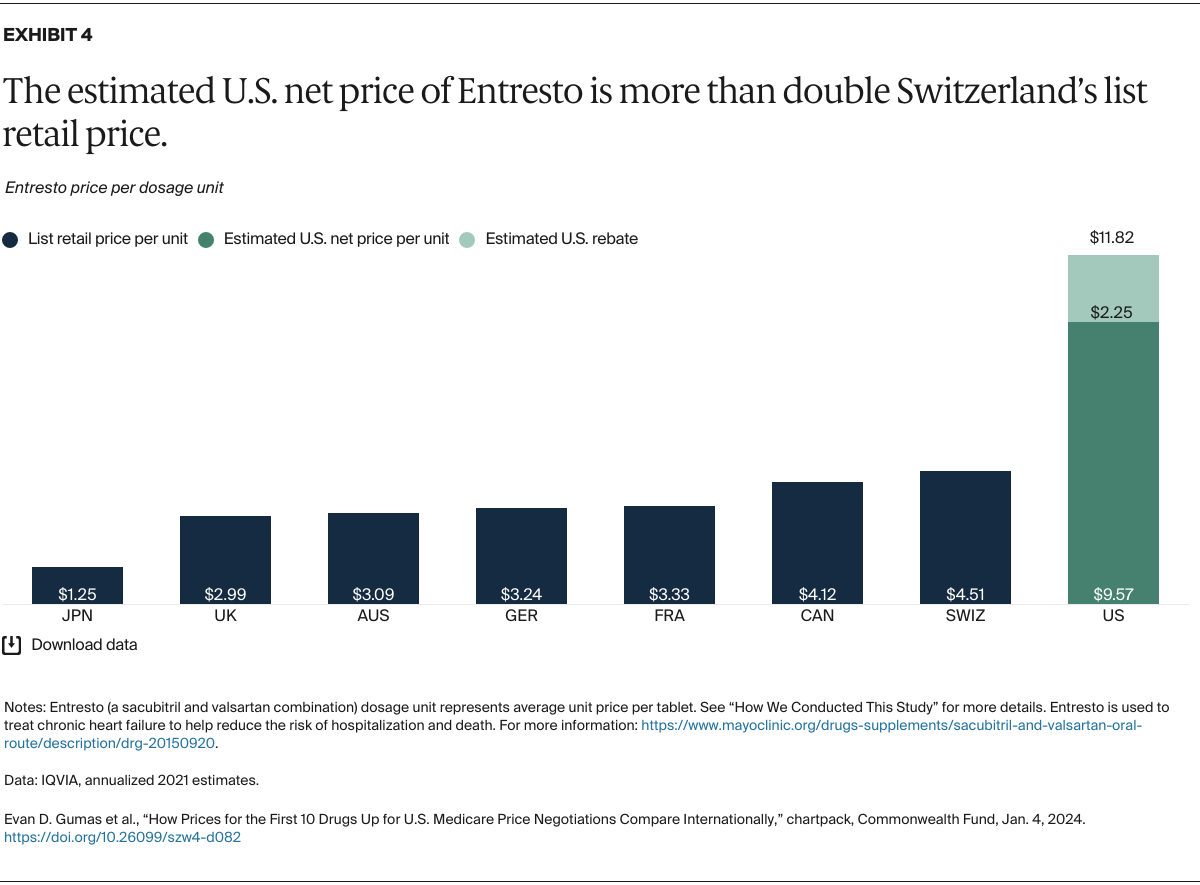
The first 10 drugs to be negotiated by Medicare — used to treat conditions like blood clots, diabetes, and autoimmune disorders — were selected because they account for a significant portion of Medicare Part D spending.7 They meet key criteria set by the IRA for negotiable drugs: 1) no generic versions available, and 2) they are either small-molecule drugs that have been on the market for at least seven years or biologics that have been on the market for at least 11 years.

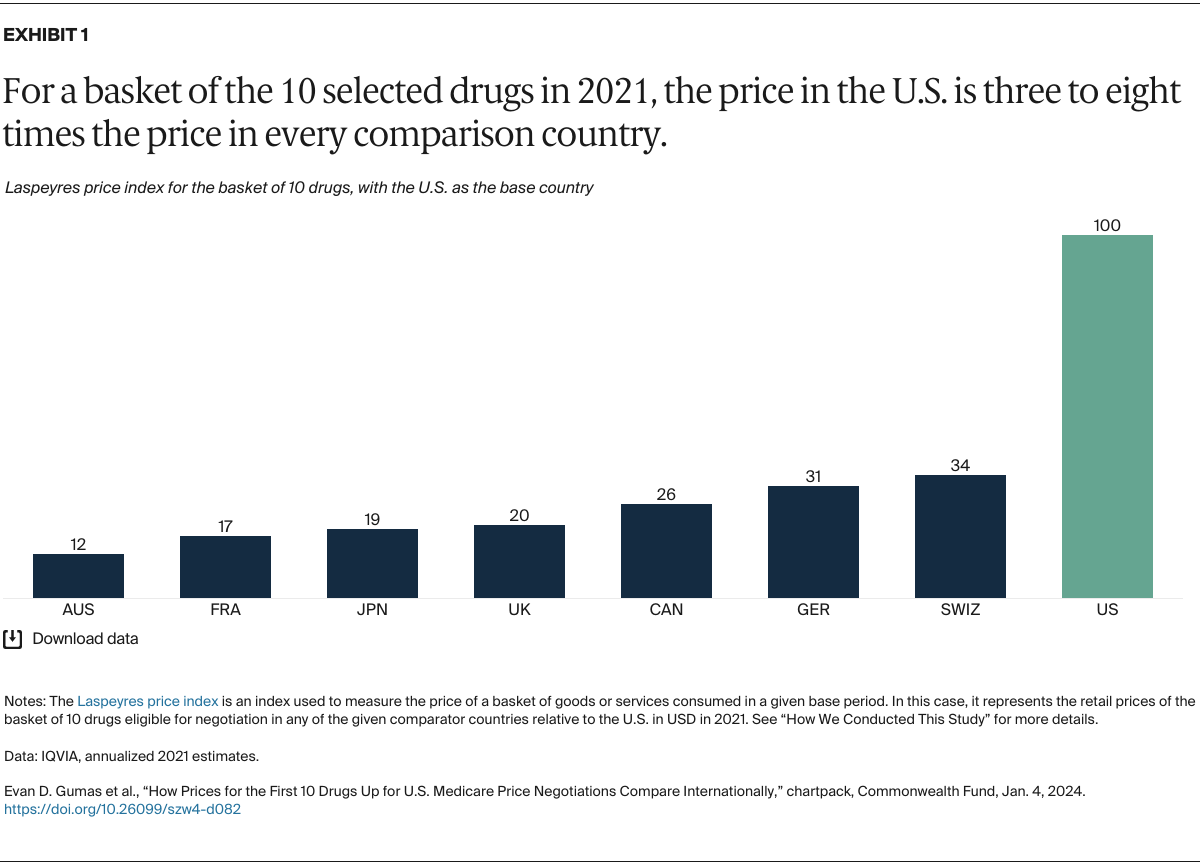
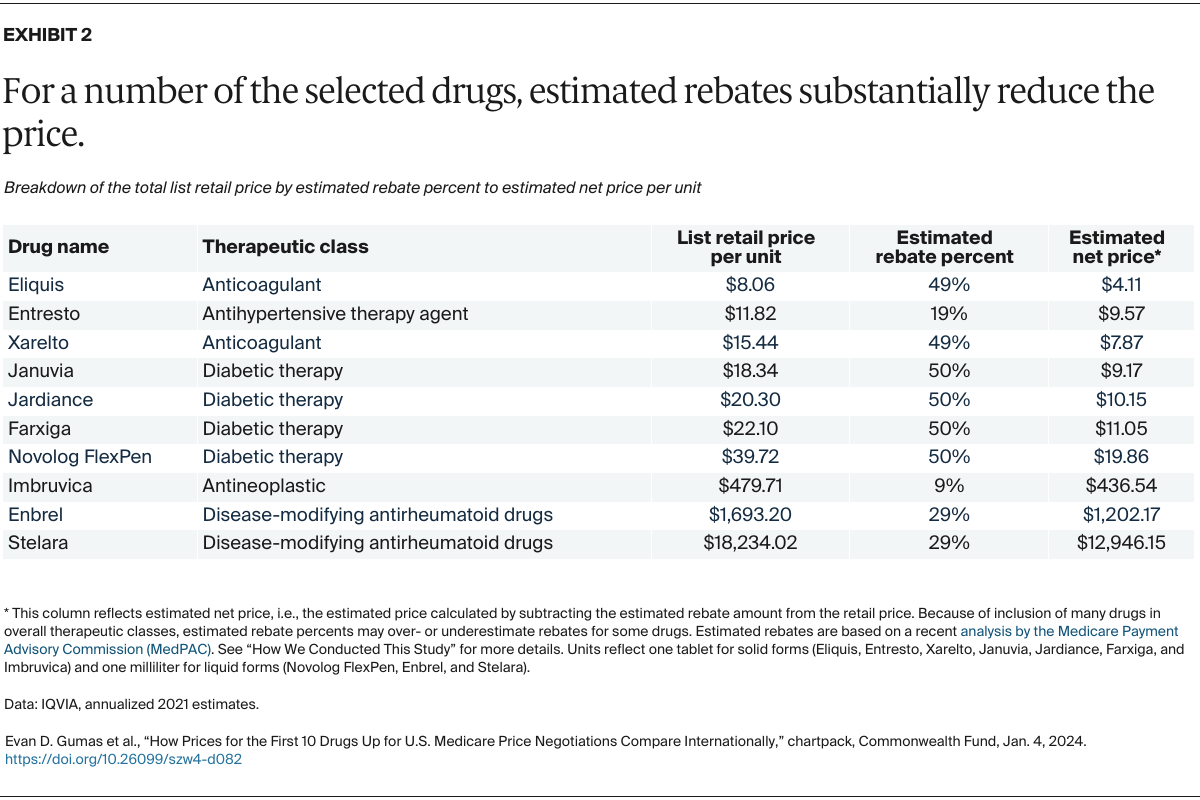
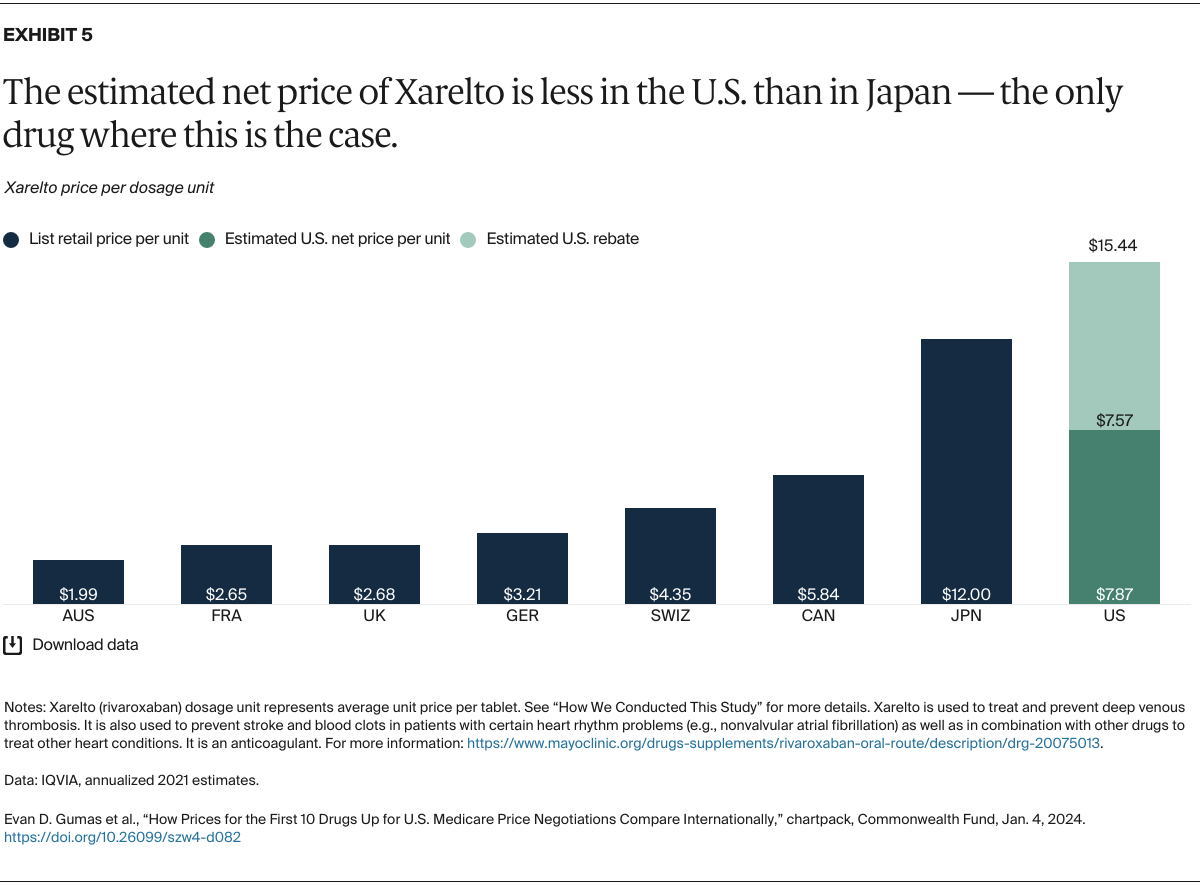
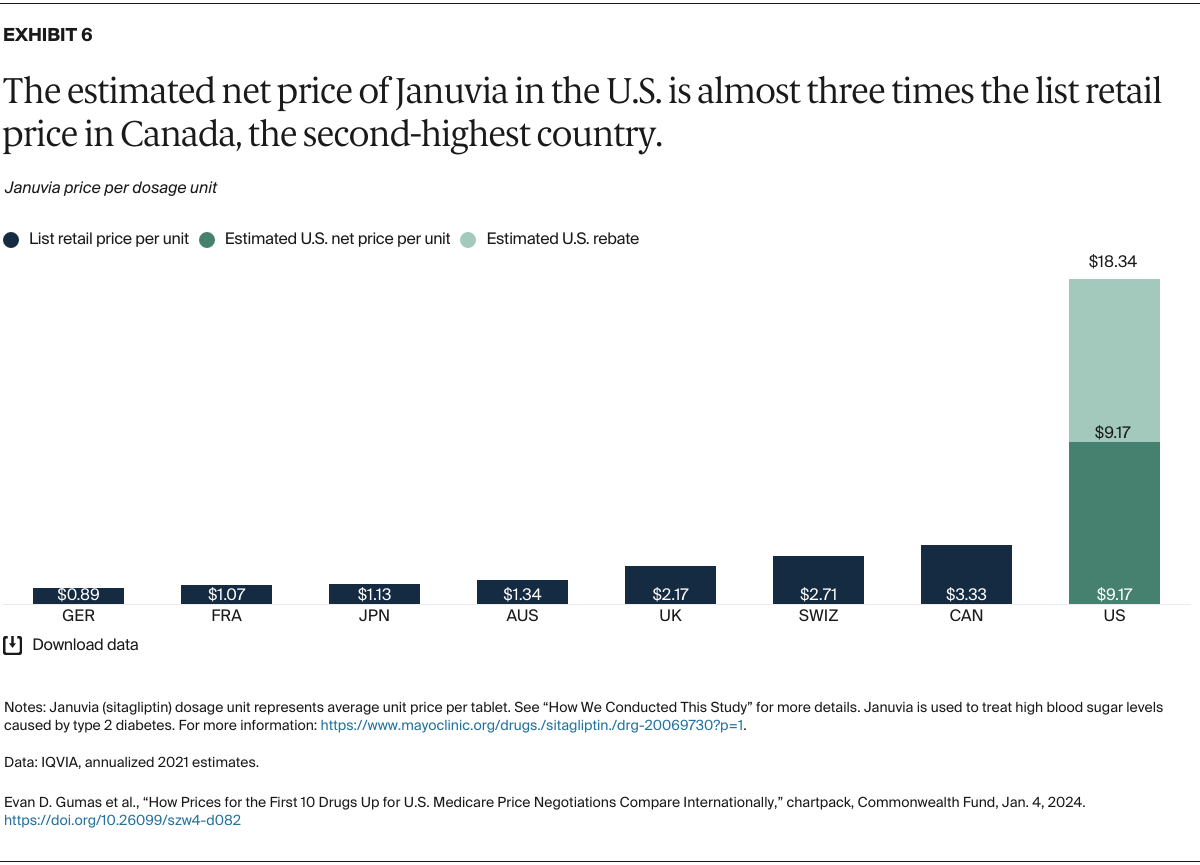
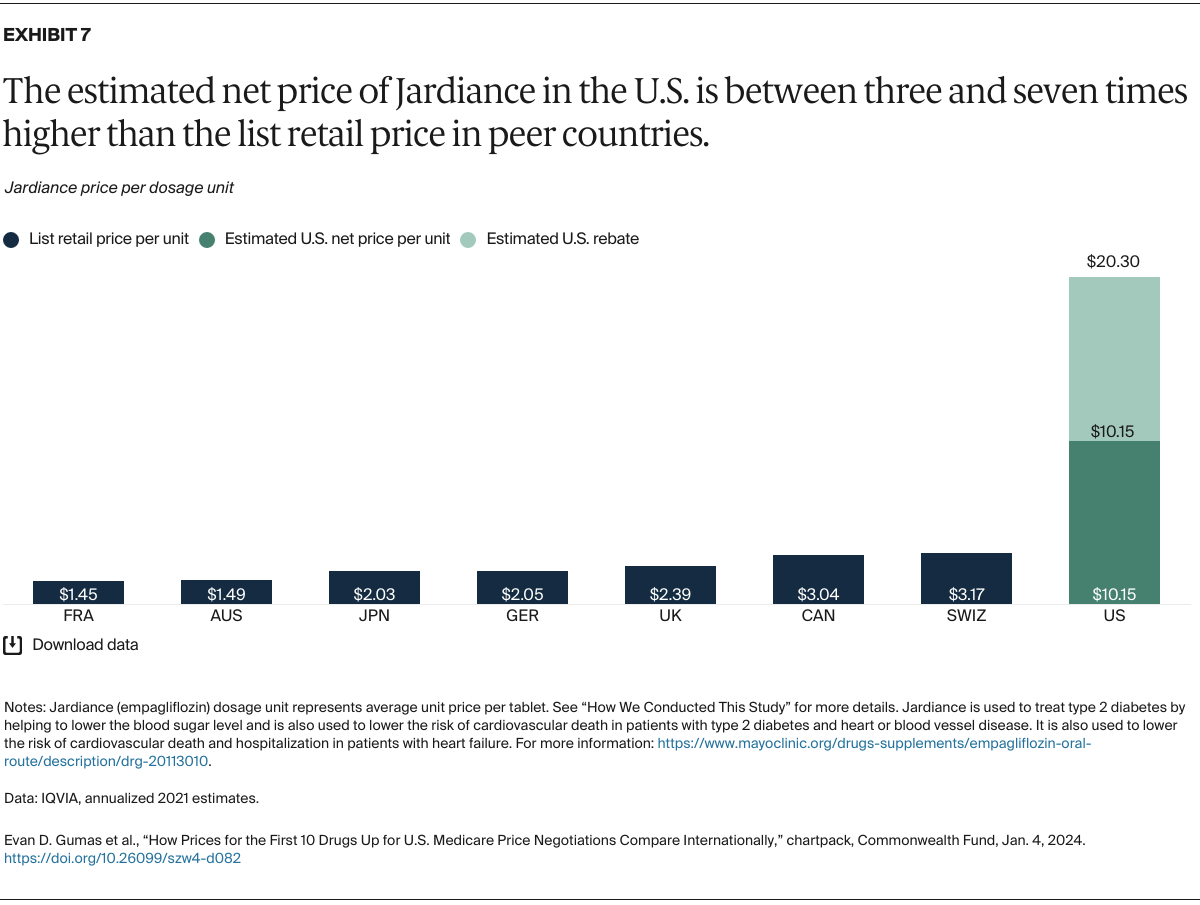
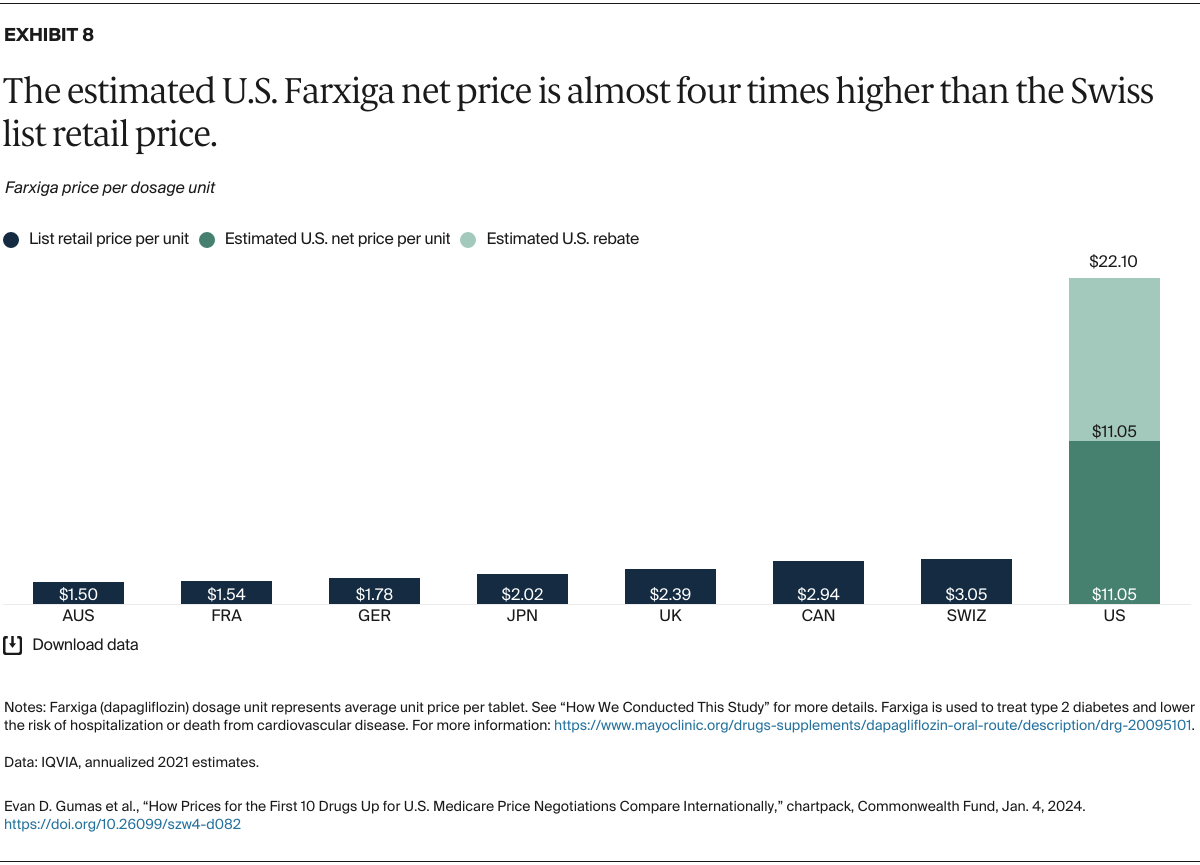
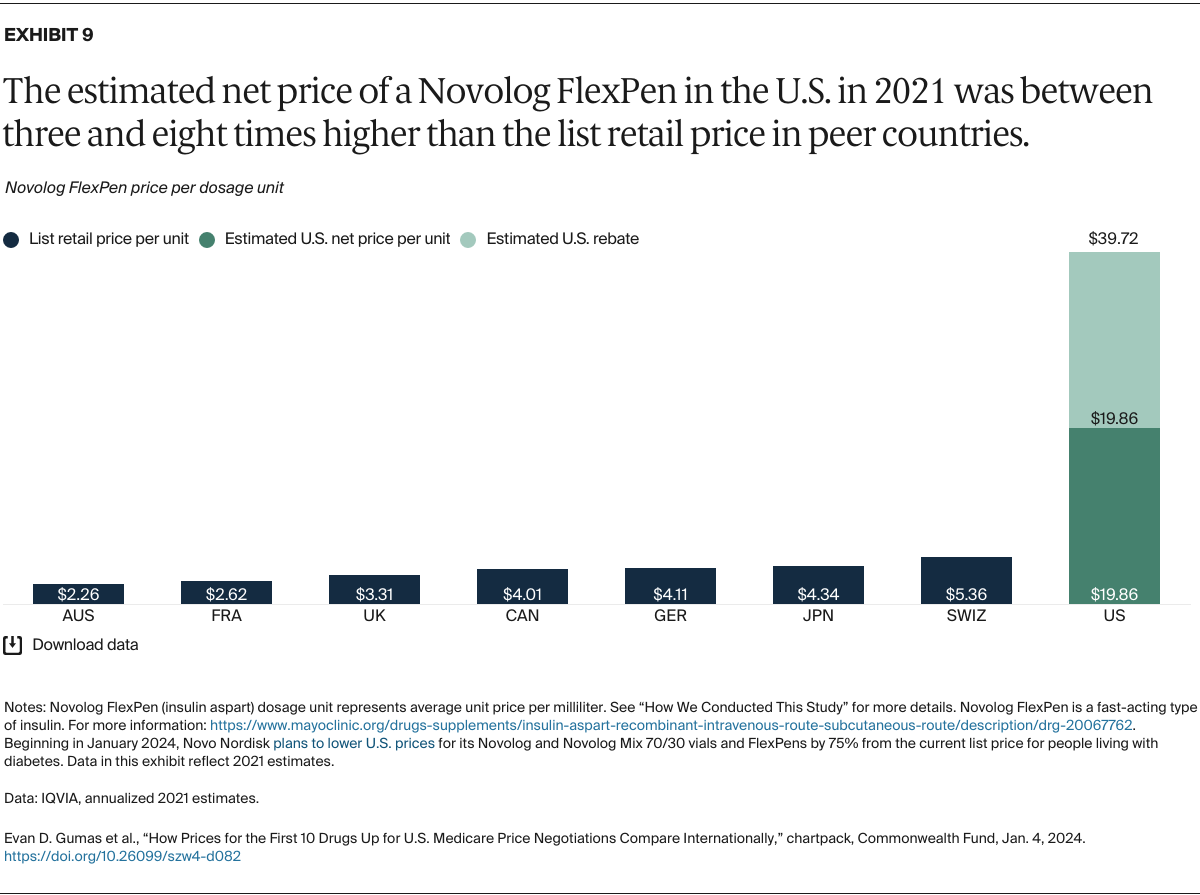
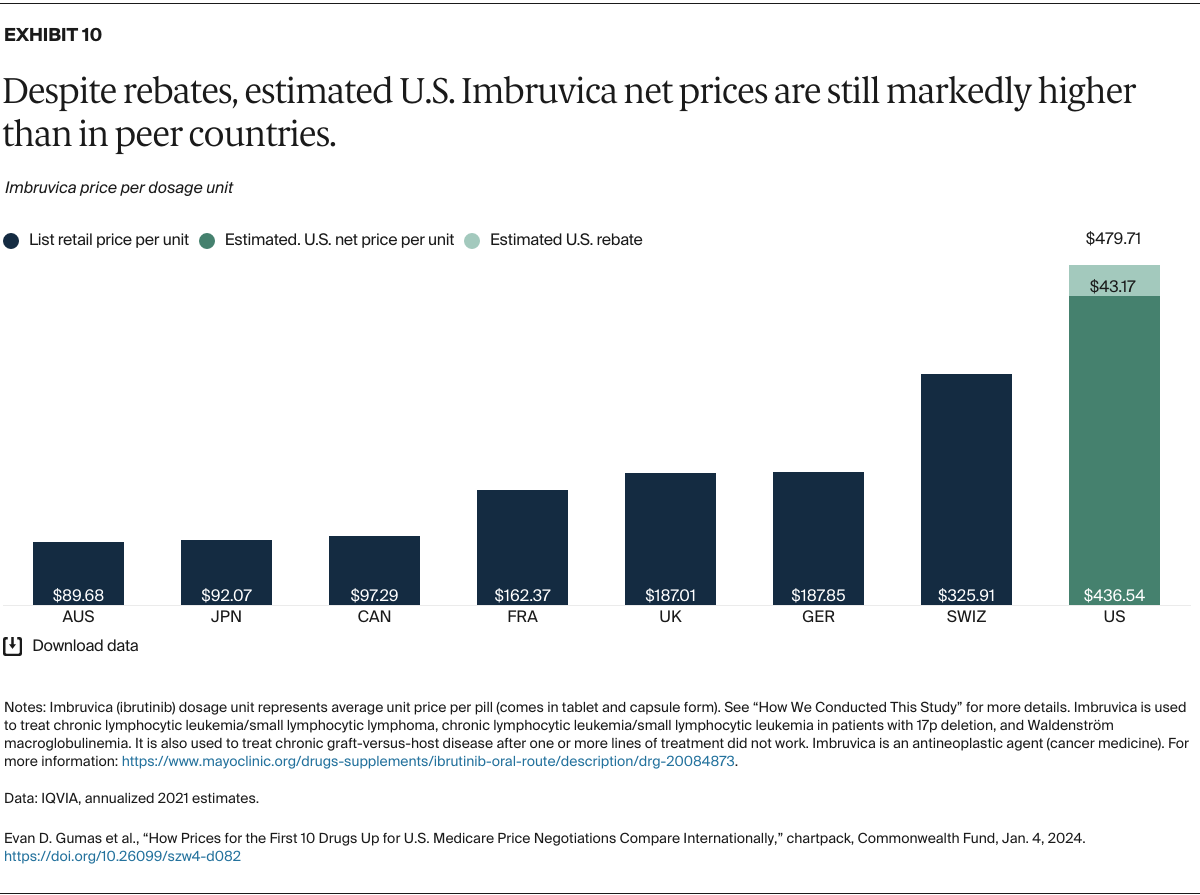
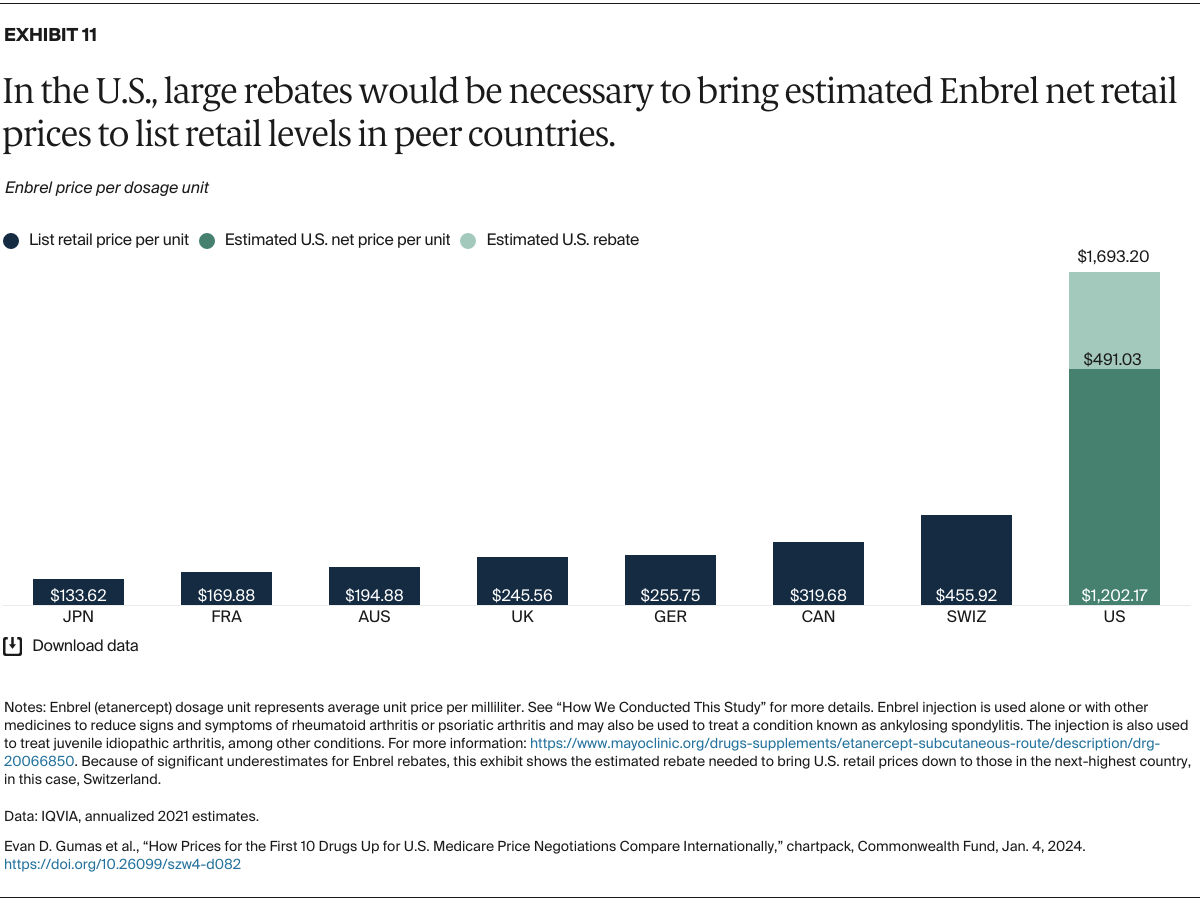
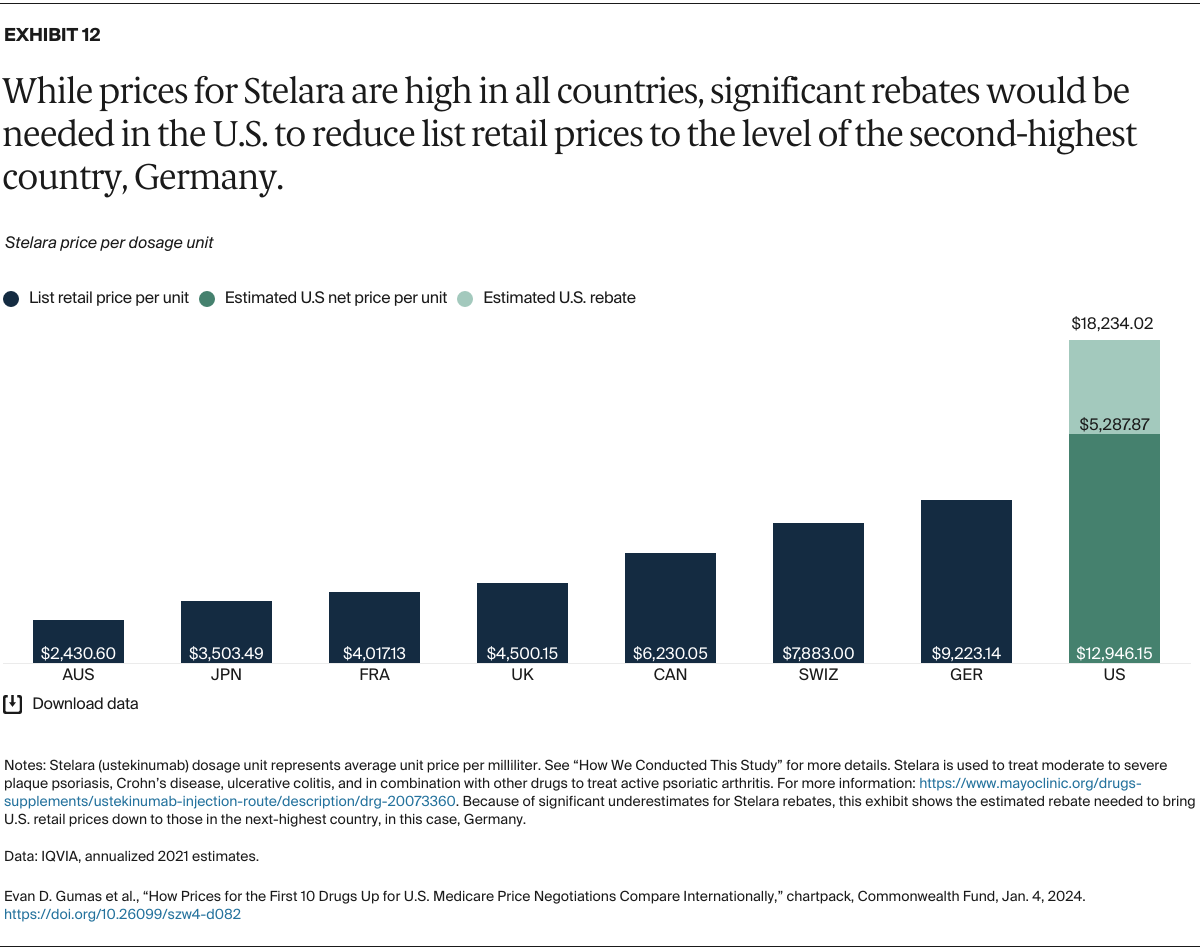
Understanding drug pricing and policy in peer countries — where drug use is similar but costs are lower — is important for benchmarking drug affordability going into the negotiation process.8 In the following charts, we look at list retail prices, which are prices charged by pharmacists to patients or insurers before any discounts, rebates, or other price reductions. List prices are a standard in international drug-pricing comparisons because of the lack of reliable data on net drug prices, which are prices that include rebates and discounts. Because of the exclusion of discounts or rebates, list prices likely overstate the prices paid by patients and insurers.9 But because list prices are set before country-specific discounts or rebates are applied, they are some of the only data points that can be systematically compared between countries. They are also the basis for discount negotiations.10 For drug prices in the United States, we also estimate net prices based on publicly available, therapeutic, classwide rebate estimates.11

The following charts draw on information made available by IQVIA, a firm that collects international comparative pharmaceutical data, and the Medicare Payment Advisory Commission, an independent congressional agency that advises the U.S. Congress on issues affecting the Medicare program (see “How We Conducted This Study” for more details and data methods).

Highlights

  • List retail prices for the 10 selected drugs are, on average, three times higher in the United States than in the other high-income countries.
  • Prices after discounts and rebates in the U.S. are higher than almost all prices before discounts and rebates in peer countries, except for Xarelto, leaving significant room for further reductions in negotiation when compared with other countries.
  • Switzerland has the second-highest prices for most of the 10 drugs, but U.S. prices remain substantially higher.
Gumas_prices_first_10_drugs_medicare_negotiations_international_Exhibit_01
Gumas_prices_first_10_drugs_medicare_negotiations_international_Exhibit_02


The 10 Selected Drugs

Gumas_prices_first_10_drugs_medicare_negotiations_international_Exhibit_03
Gumas_prices_first_10_drugs_medicare_negotiations_international_Exhibit_04
Gumas_prices_first_10_drugs_medicare_negotiations_international_Exhibit_05
Gumas_prices_first_10_drugs_medicare_negotiations_international_Exhibit_06
Gumas_prices_first_10_drugs_medicare_negotiations_international_Exhibit_07
Gumas_prices_first_10_drugs_medicare_negotiations_international_Exhibit_08
Gumas_prices_first_10_drugs_medicare_negotiations_international_Exhibit_09
Gumas_prices_first_10_drugs_medicare_negotiations_international_Exhibit_10
Gumas_prices_first_10_drugs_medicare_negotiations_international_Exhibit_11
Gumas_prices_first_10_drugs_medicare_negotiations_international_Exhibit_12
HOW WE CONDUCTED THIS STUDY

This analysis was conducted with data from IQVIA, a U.S.-based company that collects international comparative pharmaceutical data and information made available by the Medicare Payment Advisory Commission (MedPAC), an independent congressional agency that advises the U.S. Congress on issues affecting the Medicare program.

In Exhibit 1, the basket of the 10 drugs eligible for negotiation are presented using a Laspeyres price index. This index gives us an idea of what spending in the United States would look like if other countries’ prices were applied to U.S. consumption and utilization for selected drugs using USD. Laspeyres indices are used in international drug-pricing comparison and are a standard in the field. Laspeyres indices are calculated by first determining the average price per unit in each country. This was done by dividing the total list retail sales by the number of units sold. Indices are then calculated with prices weighted based on consumption patterns in a base country, in this case, the U.S. The index for a given country was calculated as:

Gumas_prices_first_10_drugs_medicare_negotiations_international_Laspeyres_formula_v4

In this equation, p is the price of an essential medicine (i) in a comparator country (c) or the United States (US), and q is the corresponding quantity in doses.

Exhibit 2 shows estimated rebate amounts and net prices for Medicare Part D beneficiaries based on annualized 2021 retail prices pulled from IQVIA for the selected drugs. Sales figures were based on list retail prices, which were those charged by pharmacists to patients or insurers. These sales figures therefore reflected distribution chain mark-ups and, where relevant, value-added taxes. The sales data did not reflect confidential rebates and discounts.

Net retail price estimates rely on analysis of 2021 Medicare Part D prescription drug event and direct and indirect renumeration (DIR) data by MedPAC. The analysis identified therapeutic class information based on the First DataBank Enhanced Therapeutic Classification System. Estimated rebate percentages reflect rebates as a proportion of what was paid to a pharmacy by Part D plan sponsors in 2021. For therapeutic classes where a range was provided, the upper limit was used (anticoagulants, antihypertensive therapy agents, and disease-modifying antirheumatoid drugs), while for drugs where a rebate range was not provided, the minimum (diabetic therapy) or maximum (antineoplastics) estimate was used where appropriate.12 When compared to prior research, estimates from MedPAC may present over- or underestimates as rebates for overall therapeutic classes represent negotiated rebates as a share of gross spending and are not specific to individual drugs.13

Exhibits 3 through 12 show list retail prices per dosage unit. List retail prices were calculated using annualized 2021 IQVIA invoiced sales estimates based on public prices in the U.S. and seven other countries. Unit prices were calculated using counting units where, for solid forms, one counting unit equals one solid form (e.g., one tablet), and, for liquid forms, one counting unit equals one milliliter of liquid (e.g., one ml syrup). Data for the eight countries were available at the pack level, meaning the number of counting units and price for a certain pack of a drug (e.g., x drug could be available in several different quantity packs within y country). Pack-level data account for differences in packaging and formulation (e.g., if x drug is available in 5mg and 10mg units) and thus provide generally more accurate unit prices, particularly when calculating the price index across countries. The final list retail prices shown in the exhibits represent the arithmetic mean of the price for one unit (whether tablet or liquid) across the different packs per country. For the purpose of this chartpack, standard 30-day supplies were not calculable and the selected drugs are instead presented at the individual unit level.

Across all countries in this analysis, including the United States, prices shown reflect list retail prices which do not include rebates and discounts. List prices reflect sticker prices for drugs before any discounts, in this case, retail prices for drugs before any discounts, rebates, or price concessions.14 List prices may be higher than the actual prices paid by insurers, though this is a limitation across international drug price comparisons as net prices are not available for all countries.

Based on the analysis presented in Exhibit 2, the U.S. bar in Exhibits 3 through 12 includes the estimated U.S. rebate for each drug and its associated estimated net price per unit. Net prices may present a better metric for drug affordability, but they do not account for uninsured patients who do not have access to many of the rebates negotiated by payers and, despite rebates to lower prices, patients may still face higher out-of-pocket costs when drug companies raise list prices.15 These exhibits also do not capture that, in many systems, even the net price is not what patients face across systems, as some patients pay either nothing or a limited copayment for their prescriptions.16 List prices are an important starting point for discount negotiations and are the only datapoints that can be systematically compared between countries. In the U.S. specifically, list prices can affect patient out-of-pocket costs for drugs, which are often calculated as a percentage of list price rather than net prices; increases in list prices in the U.S. have been found to correlate with increases in patient out-of-pocket costs.17

ACKNOWLEDGMENTS

The authors would like to thank Anna Kaltenboeck, Aaron S. Kesselheim, and David Blumenthal for their review of this piece. The authors would also like to thank Jinru Wei for analysis of the IQVIA data. From the Commonwealth Fund, the authors would like to thank Lovisa Gustafsson, Munira Gunja, Arnav Shah, Gretchen Jacobson, Bethanne Fox, Rachel Nuzum, and Celli Horstman for internal review, and Aishu Balaji, Sam Chase, Chris Hollander, Paul Frame, and Jen Wilson for editing and formatting.

NOTES
  1. Sonal Parasrampuria and Stephen Murphy, Trends in Prescription Drug Spending, 2016–2021 (Assistant Secretary for Planning and Evaluation, Office of Science and Data Policy, Sept. 2022).
  2. Stacie B. Dusetzina et al., “Cost-Related Medication Nonadherence and Desire for Medication Cost Information Among Adults Aged 65 Years and Older in the U.S. in 2022,” JAMA Network Open 6, no. 5 (May 2023): e2314211.
  3. Dusetzina et al., “Cost-Related Medication Nonadherence,” 2023.
  4. Christina Ramsay and Reginald D. Williams II, “Medicare Patients Pay More for Drugs Than Older Adults in Other Countries; Congress Has an Opportunity to Move Forward,” To the Point (blog), Commonwealth Fund, Sept. 30, 2021; and Joshua J. Gagne et al., “Comparative Effectiveness of Generic and Brand-Name Statins on Patient Outcomes: A Cohort Study,” Annals of Internal Medicine 161, no. 6 (Sept. 16, 2014): 400–7.
  5. U.S. Department of Health and Human Services, “HHS Selects the First Drugs for Medicare Drug Price Negotiation,” news release, Aug. 29, 2023.
  6. Lovisa Gustafsson and Rachel Nuzum, “CMS Announces Public Comment and Engagement Opportunities in Medicare Drug Negotiation Process,” To the Point (blog), Commonwealth Fund, Jan. 20, 2023.
  7. Centers for Medicare and Medicaid Services, “Medicare Drug Price Negotiation Program: Selected Drugs for Initial Price Applicability Year 2026,” fact sheet, Aug. 2023.
  8. Dana O. Sarnak, David Squires, and Shawn Bishop, Paying for Prescription Drugs Around the World: Why Is the U.S. an Outlier? (Commonwealth Fund, Oct. 2017).
  9. Arielle Bosworth et al., Changes in the List Prices of Prescription Drugs, 2017–2023 (Assistant Secretary for Planning and Evaluation, Office of Health Policy, Oct. 2023).
  10. Benjamin N. Rome et al., “Correlation Between Changes in Brand-Name Drug Prices and Patient Out-of-Pocket Costs,” JAMA Network Open 4, no. 5 (May 4, 2021): e218816.
  11. Medicare Payment Advisory Commission, A Data Book: Health Care Spending and the Medicare Program (MedPAC, July 2023).
  12. MedPAC, A Data Book, 2023.
  13. Immaculada Hernandez, Nico Gabriel, and Sean Dickson, “Estimated Discounts Generated by Medicare Drug Negotiation in 2026,” Journal of Managed Care and Specialty Pharmacy 29, no. 8 (Aug. 2023): 868–72.
  14. Drug Pricing Investigation: Majority Staff Report (U.S. House of Representatives, Committee on Oversight and Reform, Dec. 2021); and G. Edward Miller, Steven C. Hill, and Yao Ding, Retail Drug Prices, Out-of-Pocket Costs, and Discounts and Markups Relative to List Prices: Trends and Differences by Drug Type and Insurance Status, 2011 to 2016 (Agency for Healthcare Research and Quality, Oct. 2019).
  15. Drug Pricing Investigation, Committee on Oversight and Reform, 2021; and Neeraj Sood et al., The Association Between Drug Rebates and List Prices (USC Schaeffer Leonard D. Schaeffer Center for Health Policy and Economics, Feb. 2020).
  16. Congressional Budget Office, Prescription Drugs: Spending, Use, and Prices (CBO, Jan. 2022).
  17. Rome et al., “Correlation Between Changes,” 2021; and Anna Kaltenboeck, “How Drug Price Reforms in the Inflation Reduction Act Could Impact States,” To the Point (blog), Commonwealth Fund, Nov. 29, 2023.

Publication Details

Date

Contact

Evan D. Gumas, Research Associate, International Health Policy and Practice Innovations, The Commonwealth Fund

[email protected]

Citation

Evan D. Gumas et al., “How Prices for the First 10 Drugs Up for U.S. Medicare Price Negotiations Compare Internationally,” chartpack, Commonwealth Fund, Jan. 4, 2024. https://doi.org/10.26099/szw4-d082