
Advanced Search

Advanced Search

Current Filters

Filter your query

Publication Types

Other

to

Scorecard Highlights

  • Massachusetts, Hawaii, and New Hampshire top the 2023 State Scorecard rankings for health system performance, based on 58 measures of health care access, quality, use of services, costs, health disparities, reproductive care and women’s health, and health outcomes. The lowest-performing states were Oklahoma, West Virginia, and Mississippi.
  • Deaths from COVID-19 — as well as premature, avoidable deaths from causes like drug overdoses, firearms, and certain treatable chronic conditions — rose dramatically during the first two years of the pandemic, lowering life expectancy across the United States.
  • There was wide state variation on the Scorecard’s new measures of health outcomes and access to care for women, mothers, and infants. Maternal mortality and deaths related to substance use rose quickly among women of reproductive age during the pandemic — a particular concern given new state policies limiting reproductive care access.
  • Temporary federal policies during the COVID-19 pandemic drove uninsured rates to record lows, with nearly all states realizing gains in health coverage. But some of those policies have ended, and high health costs still saddle millions of Americans with medical debt.
  • There are ways the nation could improve health outcomes and lessen variation from state to state. Federal and state governments could: close the coverage gaps that remain and enroll uninsured people who are eligible for subsidized coverage; improve the cost protections of insurance plans; and lower barriers to reproductive health, preventive health, and behavioral health care, particularly for the most vulnerable.

Overview

Every year, the Commonwealth Fund’s Scorecard on State Health System Performance uses the most recent data to assess how well the health care system is working in every U.S. state. This year, Massachusetts achieved the best overall score, consistently placing among the top states on the seven dimensions of health system performance we evaluate. Hawaii, New Hampshire, Rhode Island, and Vermont round out the top five.

The lowest-ranked states overall are Arkansas, Texas, Oklahoma, West Virginia, and Mississippi.

Massachusetts, Hawaii, and New Hampshire top the overall rankings on health system performance for 2023.

All states face a number of daunting health challenges in the years ahead. In this report, we examine three of them:

  • Historically high rates of premature death. Still reeling from the COVID-19 pandemic, states are trying to reverse a stunning rise in preventable deaths from multiple causes. These premature deaths have lowered the nation’s average life expectancy, with people of color experiencing the steepest declines. The 2023 Scorecard reports on avoidable premature mortality in each state and looks at inequalities in health outcomes for different racial and ethnic groups.
  • Reproductive care and women’s health. Many states perform poorly when it comes to the health of women, mothers, and infants: high and increasing rates of maternal mortality, inequities in pregnancy-related outcomes for Black and American Indian/Alaska Native women, and rising rates of other avoidable deaths. In the coming years, states will face new challenges stemming from the end of pandemic-era policies that enabled people to maintain their insurance coverage after pregnancy and from new state restrictions on reproductive health care following the reversal of Roe v. Wade. This year’s Scorecard takes a deeper look at women’s and reproductive health care with 12 new measures that evaluate and rank states on maternal and pregnancy-related outcomes as well as women’s access to reproductive services and other care. Most of the data available to us reflect people’s experiences in 2021 — during the pandemic and before recent abortion restrictions took effect. These results offer a baseline for assessing future state performance.
  • Health care access and affordability. Some pandemic-era insurance policies that drove uninsured rates to record lows have ended, raising concerns over people’s ability to stay covered. At the same time, growth in health care costs is making health services even less affordable and leaving many burdened with crushing medical debt.
 

Key Findings of the 2023 State Scorecard

Health Outcomes and Healthy Behaviors

Deaths from preventable and treatable causes increased rapidly with the arrival of COVID-19, leading to unprecedented declines in U.S. life expectancy.

Since 2020, states have had to grapple with rising population health risks and mortality. These have been driven not only by the COVID-19 virus itself but also by increased risk for substance use during the pandemic and barriers to timely care for treatable conditions.

How States Rank on Health Outcomes and Healthy Behaviors

All states experienced increases in avoidable, premature deaths. The Scorecard tracks the number of deaths from preventable causes as well as from causes treatable with health care. Preventable deaths before age 75 — such as those from certain preventable infections, injuries, or illnesses — can largely be avoided through effective public health measures and primary care. Deaths from health care–treatable causes before age 75 — such as chronic illness like diabetes and cancers like colon and breast cancer — can generally be avoided through timely and effective health care interventions. Added together, these two types of mortality are known as “avoidable” deaths.1 (Refer to the Scorecard Methods for additional detail on preventable and health care–treatable conditions.)

Our measure of deaths from preventable causes includes deaths directly attributable to COVID-19 — the major reason for increased mortality rates between 2019 and 2021. The national variation in COVID deaths was influenced by a number of factors, including underlying health and socioeconomic characteristics of states’ populations, states’ pandemic responses, and the share of the population that got vaccinated.2 Firearms-related mortality is another component of avoidable premature deaths: firearms claimed 48,830 lives in 2021, and gun-related deaths have risen 23 percent since 2019, in part because of an increase in mass shooting events and suicides.3

Deaths from health care–treatable conditions, particularly those associated with chronic diseases, rose after 2019. Delays in routine and preventive care amid the pandemic’s disruptions may have contributed to the increase.4

All states experienced large increases in avoidable deaths between 2019 and 2021, leading to substantial declines in life expectancy across the U.S.5 Arizona, Louisiana, Mississippi, New Mexico, and Texas stand apart: each experienced more than a 35 percent increase in avoidable mortality rates over this period. Arizona’s rate jumped the largest percentage, by 45 percent.

Deaths from preventable and treatable causes rose between 2019 and 2021 amid the COVID-19 pandemic.

In many states, premature mortality for Black and American Indian/Alaska Native people has historically been much higher than that of other groups, and increased by a larger margin during the COVID-19 pandemic. Consequently, both groups of people, along with Hispanic Americans, experienced the largest drops in life expectancy between 2019 and 2021.6 To a great extent, this reflects higher age-adjusted rates of COVID-related deaths, particularly among Black, Hispanic, and American Indian/Alaska Native communities, as well as higher mortality from treatable conditions like cardiovascular disease and stroke.7

These disparities in outcomes have deep roots: the nation’s history of structural racism; generations of discriminatory state and federal policies around housing, education, and employment; health insurance policies that disproportionately disadvantage people of color; and well-documented variations in patient care quality by race and ethnicity. Together, these factors played a major role in many of the poor health outcomes seen across the U.S. both before and during the COVID-19 pandemic.8

Avoidable deaths from preventable and treatable causes vary by race and ethnicity, both across and within states; Black and American Indian/Alaska Native people have the highest rates.

Amid rising concerns over mental health and record-high deaths from suicide, alcohol use, and drug overdose, many Americans are struggling to get the behavioral health services they need. In addition to causing more than 1 million deaths, the COVID-19 pandemic also exacerbated mental and behavioral health issues for many Americans. The consequences have been dire: in 2021, for the first time, combined deaths from drug overdoses, alcohol, and suicide claimed upwards of 200,000 lives, some 50,000 more than the prepandemic high, in 2019.9

The U.S. maternal mortality rate nearly doubled between 2018 and 2021, and rates for American Indian/Alaska Native and Black women increased the most during the COVID-19 pandemic.

As we emerge from the worst of the pandemic, it’s become clear that Americans — especially teens — are not getting the mental health care they need.10 Recent data point to alarming increases in the shares of teens who have persistent feelings of sadness and who attempt or seriously consider suicide.11 Yet nationally, 60 percent of adolescents ages 12 to 17 who had a major depressive episode did not get any treatment, according to a 2020 federal survey; in South Carolina, it was nearly 80 percent.

Similarly, 55 percent of adults with mental illness reported not receiving treatment. Among adults who did not receive needed care, 42 percent cited cost as the primary barrier.12

U.S. adolescents and adults with mental health needs are often not able to access treatment.

Reproductive Care and Women’s Health

State performance on reproductive care and women’s health varies widely across the country. Many of the states with the worst outcomes are now implementing or considering further restrictions on reproductive care, raising concerns about inequity in access and health outcomes.

This year’s Scorecard features a new domain of health system performance — Reproductive Care and Women’s Health — to rank states on health outcomes for women, mothers, and infants and access to important health care services. The 12 indicators it includes measure mortality, such as maternal and infant deaths; high-risk events, such as severe maternal morbidity and preterm births; and ability to get routine checkups, prenatal and postpartum care, and other vital services.

The results show significant variation across states in women’s health and health care. Given that the data for these measures were collected primarily in 2021 — prior to the Supreme Court’s June 2022 decision overturning the constitutional right to abortion — they provide a baseline for assessing reproductive and women’s health across states in the coming years.

Twenty-six states now have abortion restrictions in place following the Court’s ruling.13 These restrictions will not only reduce or eliminate access to abortion services, but they could also limit access to providers that offer important preventive health care like contraception and reproductive cancer screenings. Many of these reproductive health care providers are concerned they will no longer be able to deliver high-quality care, while others fear being criminalized for providing their patients with the full spectrum of reproductive services.14

Women with low income, women of color, and women in rural communities will be especially impacted by these changes in health care access. They disproportionately live in those states that have enacted additional abortion restrictions, and they are often the ones to experience the most acute effects of any systemic failure or shortcoming.15

How States Rank on Reproductive Care and Women’s Health

Health system performance for women, mothers, and infants varies widely across states, with large differences in avoidable mortality and access to important health services.

Women faced particularly severe challenges during the COVID-19 pandemic. These included delays in getting health care and pregnancy complications stemming from the virus.16 Women of color were particularly affected, which further worsened racial and ethnic disparities in health outcomes.17

A key population health metric is the all-cause mortality rate for women of reproductive age (15 to 44). During the pandemic, deaths from all causes for women in this age group reached startling levels, jumping nearly 40 percent, from 89.4 deaths per 100,000 women in 2019 to 124.2 deaths per 100,000 in 2021. The increase included not only more maternal deaths but also other preventable deaths such as those from COVID-19, substance use, and additional conditions.18

The all-cause mortality rate in 2021 for women ages 15 to 44 shows wide variation across states, with the highest state (West Virginia) having a mortality rate triple that of the lowest state (Hawaii).

All-cause mortality rates for women of reproductive age vary widely across states and increased significantly from 2019 to 2021.

Many of these deaths could have been avoided through better, more equitable access to comprehensive health care. They could also have been avoided through greater efforts to address racial and ethnic disparities in quality of care. This is especially important given that racial inequities in quality of care persist, with pregnant women of color experiencing worse delivery-related outcomes even within the same hospitals.19

To improve these outcomes, it will be critical to integrate the continuum of reproductive health services before, during, and after pregnancy with primary care, including preventive services like cancer screenings and behavioral health services like substance use treatment.

Unfortunately, shortages of maternal care providers are commonplace across the U.S.; some communities are even considered to be “maternity care deserts.” Other women don’t have insurance coverage or can’t find providers who accept their coverage.20

State variations in care become starkly apparent when looking at specific services. In Vermont, only 11 percent of women giving birth in 2021 did not receive early prenatal care during the first trimester. But in Texas and Florida, 29 percent of pregnant women did not receive this care. Prenatal care is critical to identifying risks early and supporting people throughout their pregnancy, and it can improve outcomes for mothers and their babies.21

Postpartum visits following birth are also a critical component of comprehensive reproductive and perinatal care. Experts say up to a year of postpartum care is key to better maternal health outcomes. Alaska, New Jersey, Missouri, and Arizona stand out for having lower access to both early prenatal care and postpartum care in the first four to six weeks after birth (see maps below).

Twenty-nine percent of women in Texas and Florida did not receive early prenatal care, compared to 11 percent in Vermont.

We also find state-to-state variation in other measures of health care access that are essential to optimal health for women. Four of the states ranked among the lowest overall on reproductive care and women’s health — Alaska, New Mexico, Oklahoma, and Texas — also rank toward the bottom on two key measures for women of reproductive age: having a usual source of care and receiving a routine checkup visit (see Appendix Table G1).

Maternal deaths increased during the pandemic, particularly for women of color.

Inadequate access to health services during and after pregnancy, combined with disparities in socioeconomic status, underlying health, and quality of care, have helped drive a U.S. maternal mortality rate that is nearly twice as high as rates in other high-income countries. And for many people of color in the U.S., maternal death rates are even higher.22

During the pandemic, maternal deaths rose considerably amid the severe disruptions in health care delivery. COVID-19 was an additional clinical risk factor and slow vaccine uptake raised the risk of death for those who were pregnant.23 Maternal mortality jumped from 20.1 deaths per 100,000 live births in 2019 to 32.9 per 100,000 in 2021. A federal report found that COVID was a contributing factor in more than 30 percent of maternal deaths in 2021.24

The maternal death rate for AIAN women jumped by nearly 70 deaths per 100,000 live births between 2019 and 2021, while the rate for Black women increased by more than 25 deaths per 100,000, putting them well above other racial and ethnic groups.25 Among the likely causes were the greater burden of COVID-19 in Black and AIAN communities; higher rates of poverty, food insecurity, and other social risk factors; and disparities in insurance coverage and quality of care.26

The U.S. maternal mortality rate nearly doubled between 2018 and 2021, and rates for American Indian/Alaska Native and Black women increased the most during the COVID-19 pandemic.

These outcomes differed depending on where women lived. Maternal death rates between 2019 and 2021 were as low as 9.6 per 100,000 live births in California, but higher than 40 deaths per 100,000 births in Arkansas, Alabama, Louisiana, Tennessee, and Mississippi. It’s important to note that California has made concerted efforts to address racial equity in maternal health over the past decade.27

Maternal mortality between 2019 and 2021 varied widely across states, with rates above 40 deaths per 100,000 live births in Arkansas, Alabama, Louisiana, Tennessee, and Mississippi.

States must confront a confluence of emerging crises that are putting women’s health at risk.

The prolonged pandemic, coupled with the existing maternal mortality crisis and inequities in care delivery, has driven up avoidable deaths for women and presented unprecedented challenges to state leaders.

As states struggle to find ways to maintain access to coverage and care as pandemic-era policies expire, the overturning of Roe v. Wade has further fractured reproductive health care access. Which state you live in now determines whether you have access to a full range of reproductive health care services. And for low-income women and women of color, the stakes are even higher.

The data we’ve presented show that in many states that have imposed abortion restrictions, women had poor health outcomes even prior to the 2022 Supreme Court ruling. Twelve of the 15 states that rank lowest on our measures of reproductive care and women’s health have restrictive abortion laws as defined by the Guttmacher Institute.28 The trends are particularly pronounced for all-cause mortality and for maternal and infant deaths (see Appendix Table G1). States with abortion restrictions also had fewer maternal care providers before 2022.29 The additional limitations on reproductive care in states with these poor outcomes raise concern that existing gaps could widen in the coming years.

Health Coverage and Access to Care

Health insurance coverage rates reached record highs in 2021, but declines loom on the horizon, and concerns with the affordability of health care are growing.

The number and percentage of Americans lacking health insurance has fallen to historic lows. That’s because of temporary policies during the pandemic aimed at helping people get covered and stay covered, as well as recent decisions by several states to expand Medicaid eligibility under the Affordable Care Act (ACA). Still, many people in the United States remain uninsured or inadequately covered. As pandemic-era policies expire and health care costs continue to climb, the outlook is likely to worsen.

How States Rank on Health Care Access and Affordability

The national adult uninsured rate declined during the first two years of the pandemic, from nearly 13 percent in 2019 to 12.1 percent in 2021 (see Appendix Table C2). Across the nation, uninsured rates declined in all but seven states, falling even in most states that had not expanded their Medicaid programs. This nationwide improvement in coverage was attributable to record enrollment in Medicaid (93 million by 2023)30 and in the ACA insurance marketplaces (16.4 million by 2023).31 Four policy changes accounted for these coverage gains:

  • The 2020 federal requirement that states keep Medicaid beneficiaries continuously enrolled through the end of the public health emergency, in exchange for enhanced federal matching funds for state Medicaid programs.
  • The decision by seven additional states between 2019 and 2021 — Idaho, Maine, Missouri, Nebraska, Oklahoma, Utah, and Virginia — to expand Medicaid eligibility.
  • More generous marketplace premium subsidies that were put in place in 2021 and extended through 2025 under the Inflation Reduction Act.
  • Increased federal funding for ACA marketplace outreach and enrollment.

The substantial gains achieved through Medicaid’s continuous coverage requirement may prove ephemeral, however. The requirement ended in April 2023, leaving states with the complex and difficult task of determining whether people enrolled are still eligible. An estimated 15 million people may lose Medicaid coverage over the next year, either from changes in eligibility or through administrative error. Of those, the Congressional Budget Office projects that 6.2 million will become uninsured.32

Among those most at risk of losing coverage are people who have Medicaid because they were pregnant but are now out of the postpartum period, and young adults who aged out of Medicaid and the Children’s Health Insurance Program (CHIP). This will particularly affect those who live in states that have not expanded Medicaid or have not yet extended postpartum coverage as allowed during the pandemic.33 Coverage losses could be exacerbated by the burdensome process of redetermining eligibility for so many people, since state Medicaid agencies are likely to fall behind in enrolling new applicants as a result.

Adult uninsured rates have fallen since 2019 but remain highest in states that have not expanded their Medicaid programs.

In some states, medical debt is a crisis for the insured and uninsured alike. Despite the nation’s substantial gains in health insurance coverage, many Americans are struggling to pay off medical debt. There are two key reasons: 1) millions remain uninsured, and 2) many people with coverage are underinsured, meaning they may still face high costs when they get health care. In 2022, the Commonwealth Fund found that nearly a quarter of adults had coverage all year but were still underinsured.34 Of those, 39 percent were paying off medical debt, slightly higher than the share of uninsured people with medical debt.

In 2021, there was an estimated $88 billion of medical debt on consumer credit records, accounting for 58 percent of all debt-collection entries on credit reports — by far the largest single source of debt.35 This estimate is an undercount of U.S. households’ medical debt, since it does not include debt people owe directly to hospitals and other providers.

Of the estimated 230 million people in the U.S. who had credit reports in February 2022, nearly 13 percent had medical debt in collections. The share of people with medical debt in collections varied significantly across the country, from 2.4 percent in Minnesota to 24 percent in West Virginia (see Appendix Table C1). Southern states had the highest rates of medical debt in collections; the region not only has some of the highest state uninsured rates in the country, but out-of-pocket cost exposure in commercial health plans is also among the highest relative to people’s incomes.36

In some states, particularly in the South, as many as a quarter of residents have medical debt; a symptom of coverage gaps and inadequate insurance.

How the U.S. Can Address Its Health Challenges

The 2023 Scorecard on State Health System Performance shows that all states face challenges in ensuring the health and well-being of their residents. How can state and federal legislators and agencies address these challenges and improve health outcomes?

Avoidable Mortality and Behavioral Health

  • Expand the primary care workforce. Primary care providers play a key role in coordinating their patients’ care, screening for acute and chronic illness, managing treatment for chronic disease, and educating patients on issues related to public health.37 Federal and state policymakers can bolster the primary care workforce by incentivizing the creation of training programs for primary care clinicians.
  • Promote primary care and behavioral health integration. Federal policymakers could provide additional supports to states in designing and implementing waivers, demonstrations, and state plan amendments that scale integrated care in Medicaid and the Children’s Health Insurance Program; align payments to incentivize the integration of primary care and behavioral health; and ensure reimbursement levels are adequate to promote integrated primary care in small, rural, and underresourced practices.38
  • Increase treatment for behavioral health needs of children and adolescents. State policymakers could adopt and implement evidence-based models such as the collaborative care model which brings mental health services into pediatric settings. Adequate reimbursement rates, start-up costs, and technical assistance are essential elements to successful implementation of this model.39
  • Increase access to addiction care. Federal policymakers could codify regulatory changes made during the pandemic that gave providers and patients more flexibility to administer effective opioid addiction treatments.40 Some states are also taking action to remove administrative barriers.41
  • Expand comprehensive harm reduction policies. States can support and work with local jurisdictions to implement effective harm-reduction policies and programs, such as increased access to naloxone, supplies for safe drug use, and supervised consumption sites.42
  • Develop community-based health care workforces focused on team care. Offer financial assistance, such as loan repayment, to providers who serve in medically underserved communities. Expand community health worker programs to train individuals to provide basic health-related services and support within their communities.

Reproductive Care and Women’s Health

  • Extend and provide support for evidence-based implementation of Medicaid’s postpartum coverage to 12 months. The American Rescue Plan Act gives states the option of extending Medicaid postpartum coverage to 12 months, although this option is available to states for only five years. So far, 36 states have taken the option, six are planning to, and three have opted for a more limited extension.43 Congress could make the option permanent. In addition to eligibility extension, states can adopt changes that improve postpartum, preventive, and intensive health care services during the year following a Medicaid-financed pregnancy.
  • Promote policies, innovative payment models, and digital tools that support the continuum of reproductive health care — from family planning, abortion services, and maternity care to postpartum and well-woman care. To address the maternal health crisis and wide racial disparities, federal and state policymakers could advance policies and approaches that further expand reproductive services in the delivery of comprehensive health care.44
  • Provide funding to community-based organizations focused on advancing maternal health outcomes and addressing racial equity. Change is needed at the community level, where women and birthing people live and seek services. The federal government could increase funding for reproductive and maternal health care, particularly through community-based organizations prioritizing birth equity.45
  • Expand and diversify the maternal and reproductive health workforce by investing in teams of physicians, midwives, doulas, community health workers, and maternity care coordinators. Across the continuum of maternal health, team-based care — and financial support for such care — is needed. State policymakers can take steps to increase the availability of birthing facilities, especially in high-need areas, and grow the maternal health workforce by incentivizing and diversifying educational programs for nurses, midwives, and doulas.46 States that have restricted abortion can aid the retention of reproductive health care providers by eliminating the potential that these clinicians could face punitive actions or criminal punishment.
  • Invest in care models that support mothers with maternal mental health conditions and substance use disorders.47
  • Increase financial investments in social determinants of health that influence maternal health outcomes. To increase economic and social service supports for children and women, Congress and states could expand paid family leave, tax credits, unemployment compensation, childcare, and affordable housing assistance for children and for women of reproductive age.48 States can also use the Temporary Assistance for Needy Families (TANF) program to provide lower-income, single mothers of young infants with financial support similar to paid maternity leave.49
  • Continue to prioritize the elimination of racial inequities in maternal health. Adopt policies and quality improvement approaches that center health equity through Medicaid quality strategies, hospital regulations, community investments, improved data collection standards, and other approaches.

Insurance Coverage and Affordability of Care

  • Fill the Medicaid coverage gap. Congress could create a federal fallback option for Medicaid-eligible people in the 10 states that have yet to expand Medicaid.50
  • Permanently extend enhanced marketplace premium subsidies set to expire in 2025. These larger subsidies led to record enrollment in marketplace plans. Congress could make these subsidies permanent to keep people enrolled in coverage and to encourage new enrollment.
  • Create a longer period of continuous Medicaid eligibility. Disruption in Medicaid coverage because of eligibility changes, administrative errors, and other factors can leave people uninsured and unable to get care. Congress could apply the lessons of the pandemic and give states the option to maintain continuous enrollment eligibility for adults for 12 months without the need to apply for a waiver — just as has been done for children in Medicaid and the Children’s Health Insurance Program.51
  • Create an autoenrollment mechanism. Research shows that many uninsured people are eligible for Medicaid or subsidized marketplace coverage. By allowing autoenrollment in comprehensive health coverage, Congress could move the nation closer to universal coverage.52
  • Lower deductibles and out-of-pocket costs in marketplace plans. Congress could extend cost-sharing reduction subsidies to middle-income people and change the benchmark plan in the ACA marketplaces from silver to gold, which offers better financial protection.53 These policies would reduce the number of people who are underinsured and lower the number of uninsured by an estimated 1.5 million.54
  • Lower health care cost growth. Federal and state policymakers could take steps to address the high health care prices that are driving up commercial insurance premiums and deductibles, such as by creating new public plan options.55
  • Protect consumers from being financially ruined by medical debt. Many states have passed legislation banning aggressive collection activities by hospitals and collection agencies. And the Biden administration is taking steps to protect consumers from being financially damaged by medical debt, including scrutinizing provider bill collection behavior.56 Congress could reinforce those actions by requiring providers to allow debt repayment grace periods following illness or during appeals processes; ending such hospital practices as suing patients, garnishing wages, or placing liens on homes; and banning or placing limits on the charging of interest.57


In the coming years, women’s health and reproductive care will continue to be at the forefront of political and policy debates — particularly as additional legal challenges surrounding abortion move through the court system and the effects of judicial and legislative policy on women’s health and reproductive health access become clear.58

At the same time, policymakers must contend with the behavioral health crisis, the lingering effects of COVID, and gaps in the health insurance system that are leaving millions without timely access to affordable care or protection from medical debt.

These challenges are considerable. The policies presented here show, however, that states and the federal government have a wide range of options for making progress in the near term and for improving the health of all U.S. residents over time.

2023 Summary of State Rankings Table
Scorecard Methods

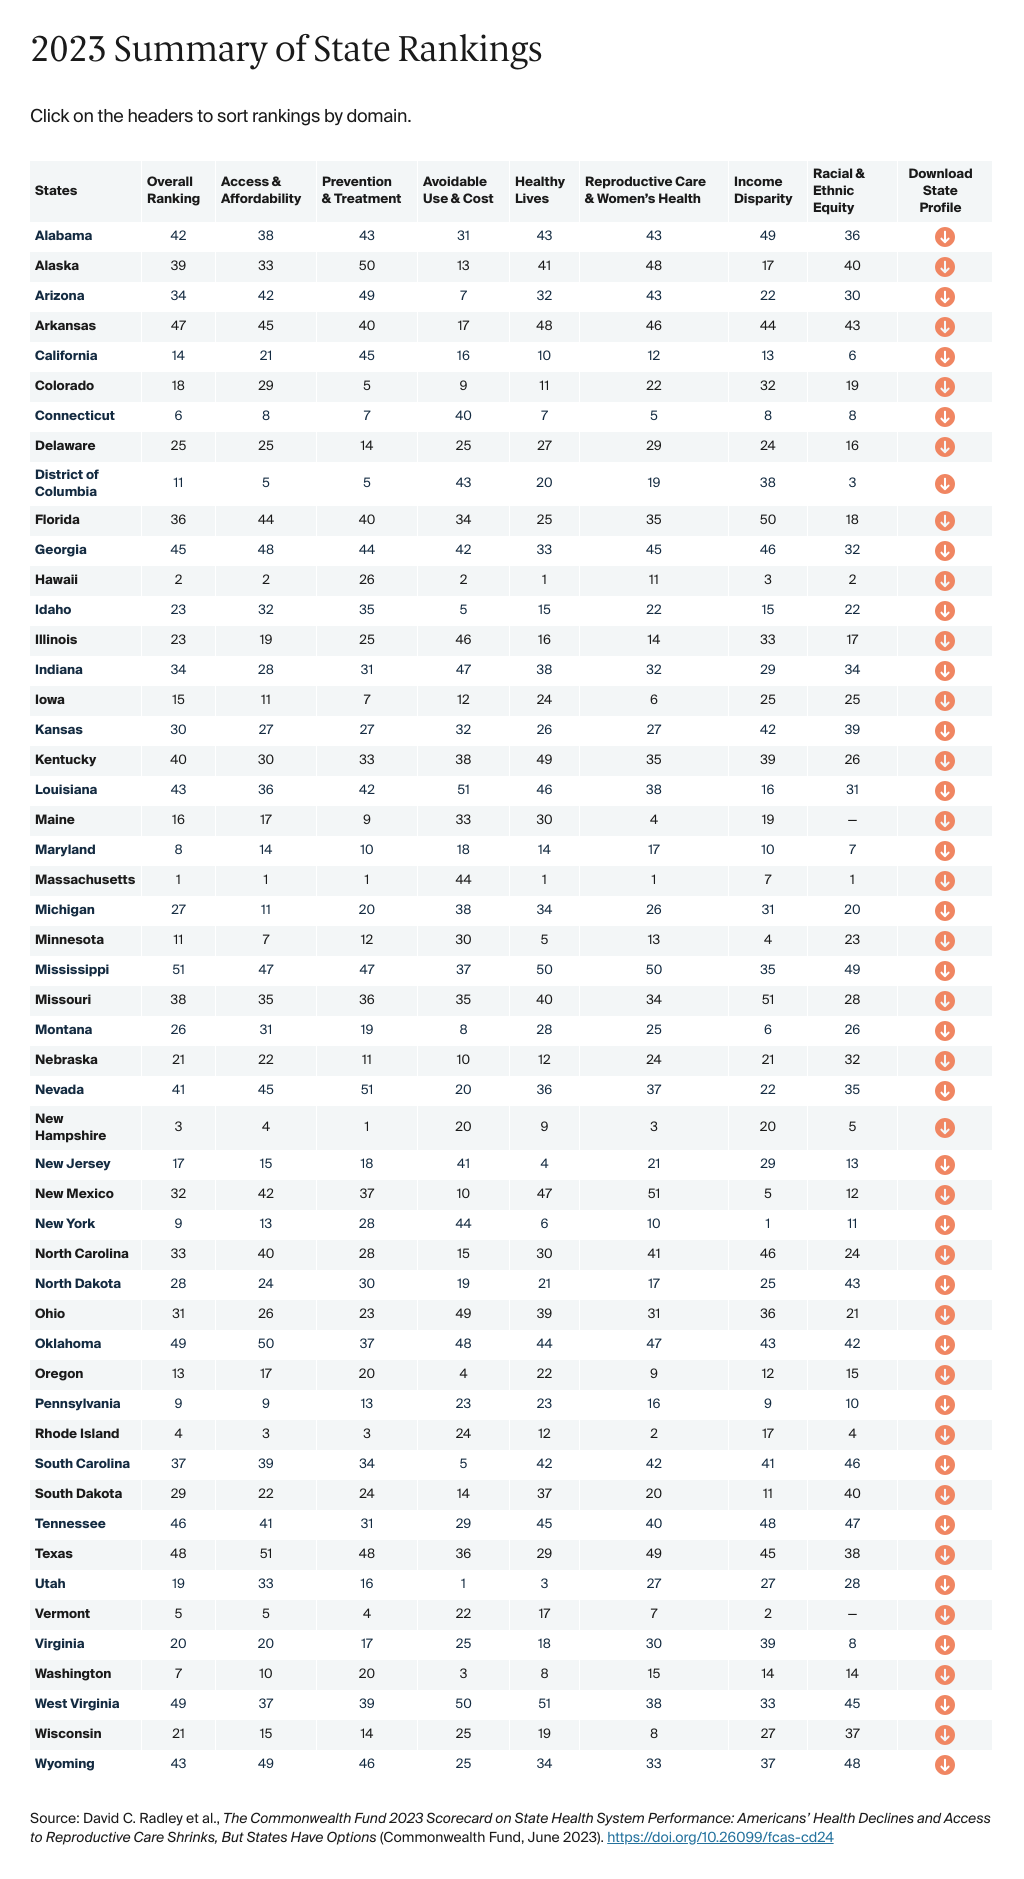
The Commonwealth Fund’s 2023 Scorecard on State Health System Performance evaluates states on 58 performance indicators grouped into five dimensions, including a new dimension focused on Reproductive Care and Women’s Health.

The report generally reflects data from 2021.

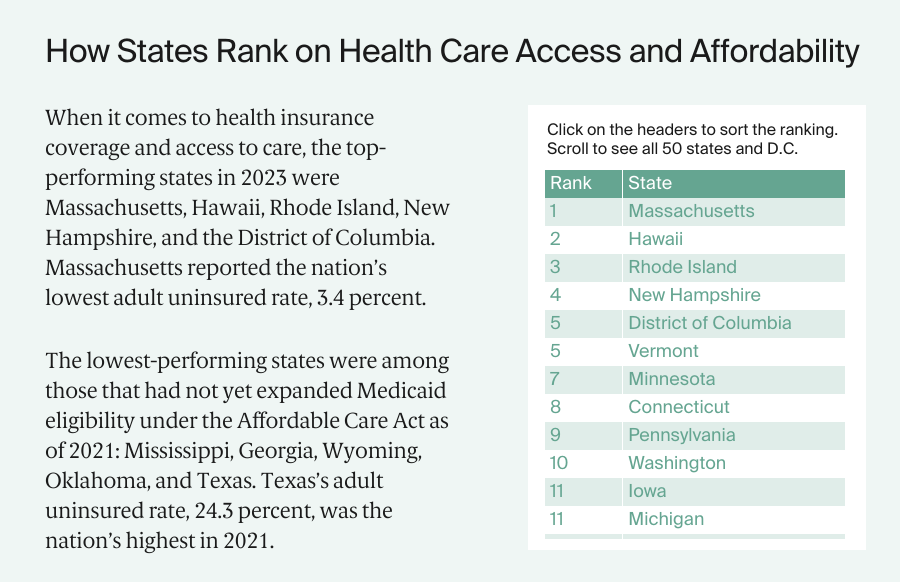
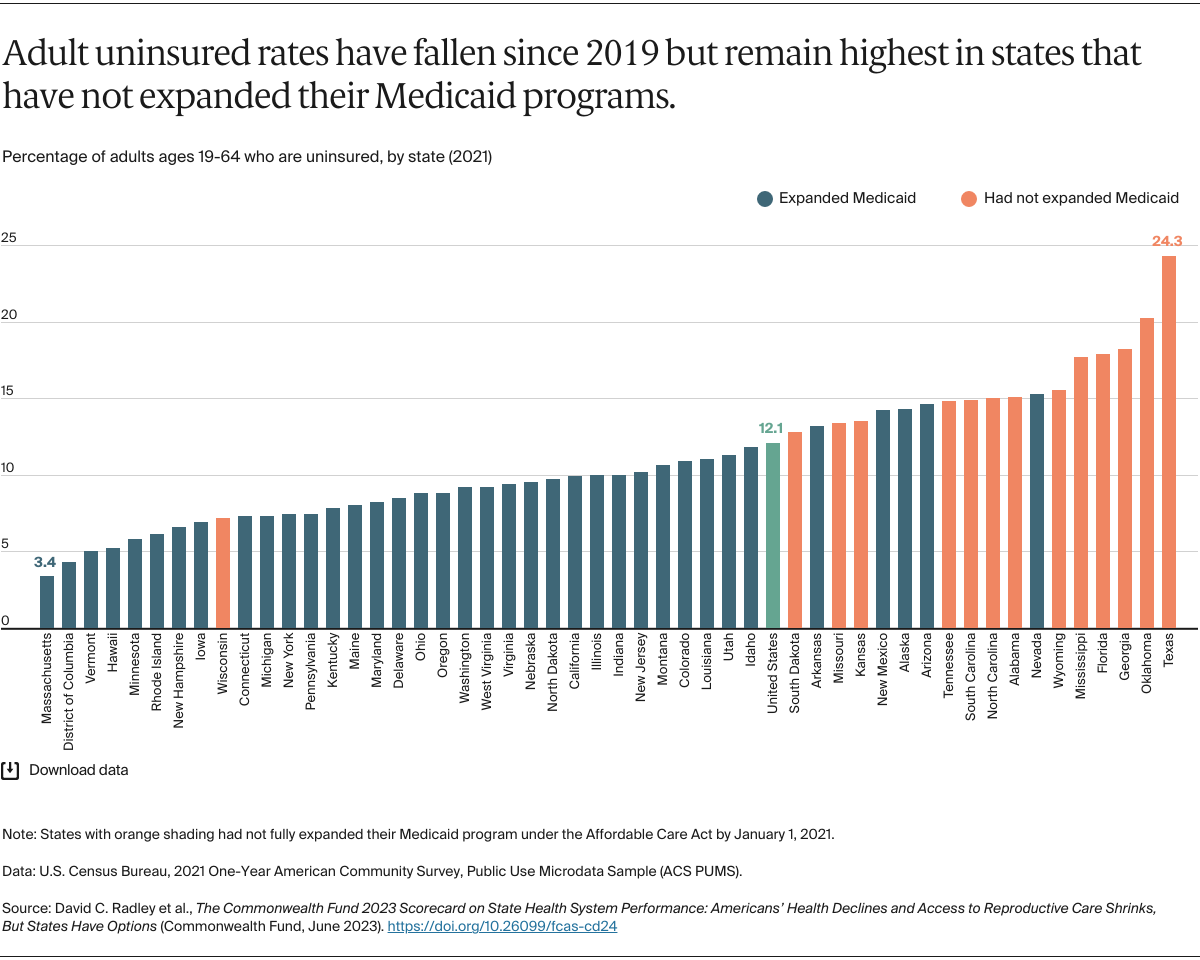
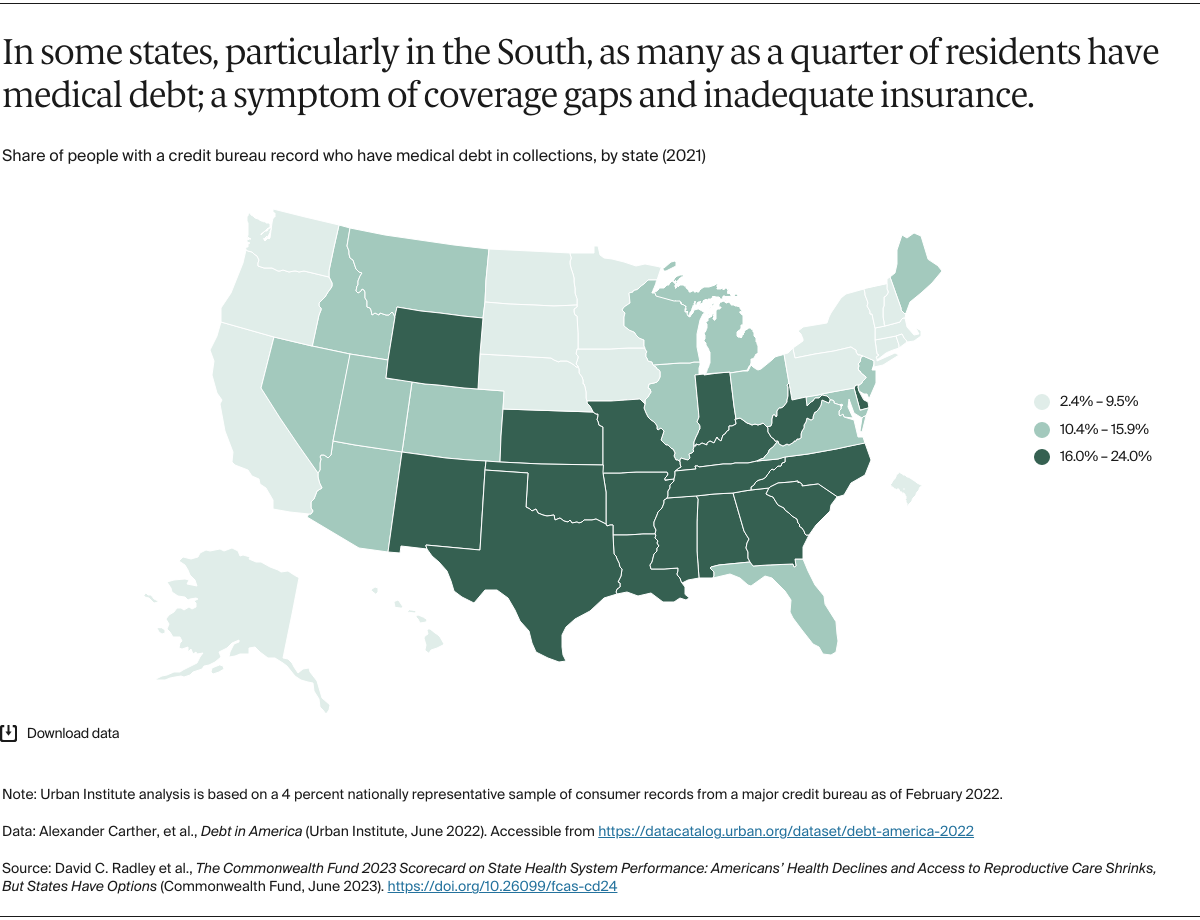
Access and Affordability (8 indicators): includes rates of insurance coverage for children and adults, as well as individuals’ out-of-pocket expenses for health insurance and medical care, cost-related barriers to receiving care, rates of medical debt, and receipt of dental visits.

Prevention and Treatment (15 indicators): includes measures of receipt of preventive care (including COVID-19 booster vaccines) and mental health care, as well as measures of quality in ambulatory, hospital, postacute, and long-term care settings.

Potentially Avoidable Hospital Use and Cost (13 indicators, including several measures reported separately for distinct age groups): includes indicators of hospital and emergency department use that might be reduced with timely and effective care and follow-up care, successful discharges for skilled nursing home patients, estimates of per-person spending among Medicare beneficiaries and working-age adults with employer-sponsored insurance, and the share of Medicare and employer-sponsored insurance spending directed toward primary care.

Healthy Lives (10 indicators): includes measures of premature death, health status, health risk behaviors and factors (including smoking and obesity), and tooth loss.

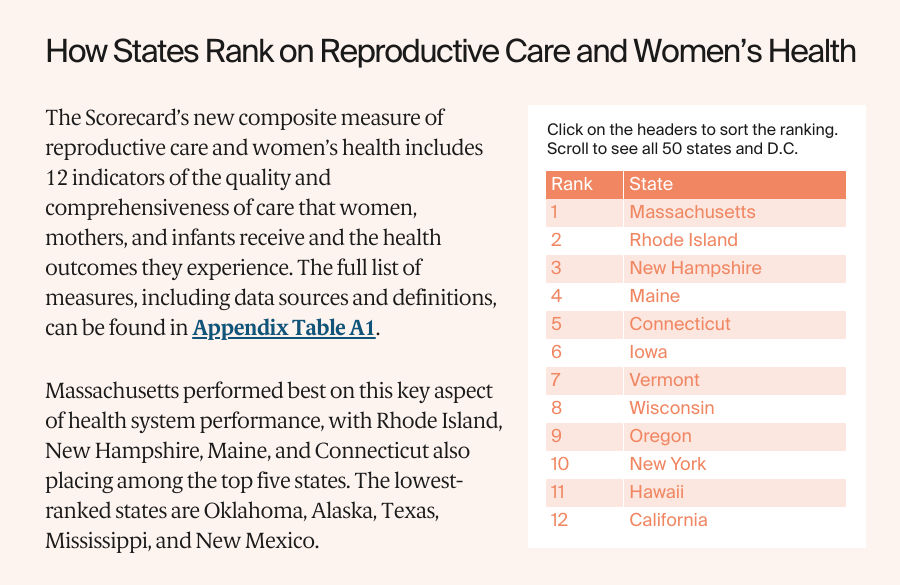
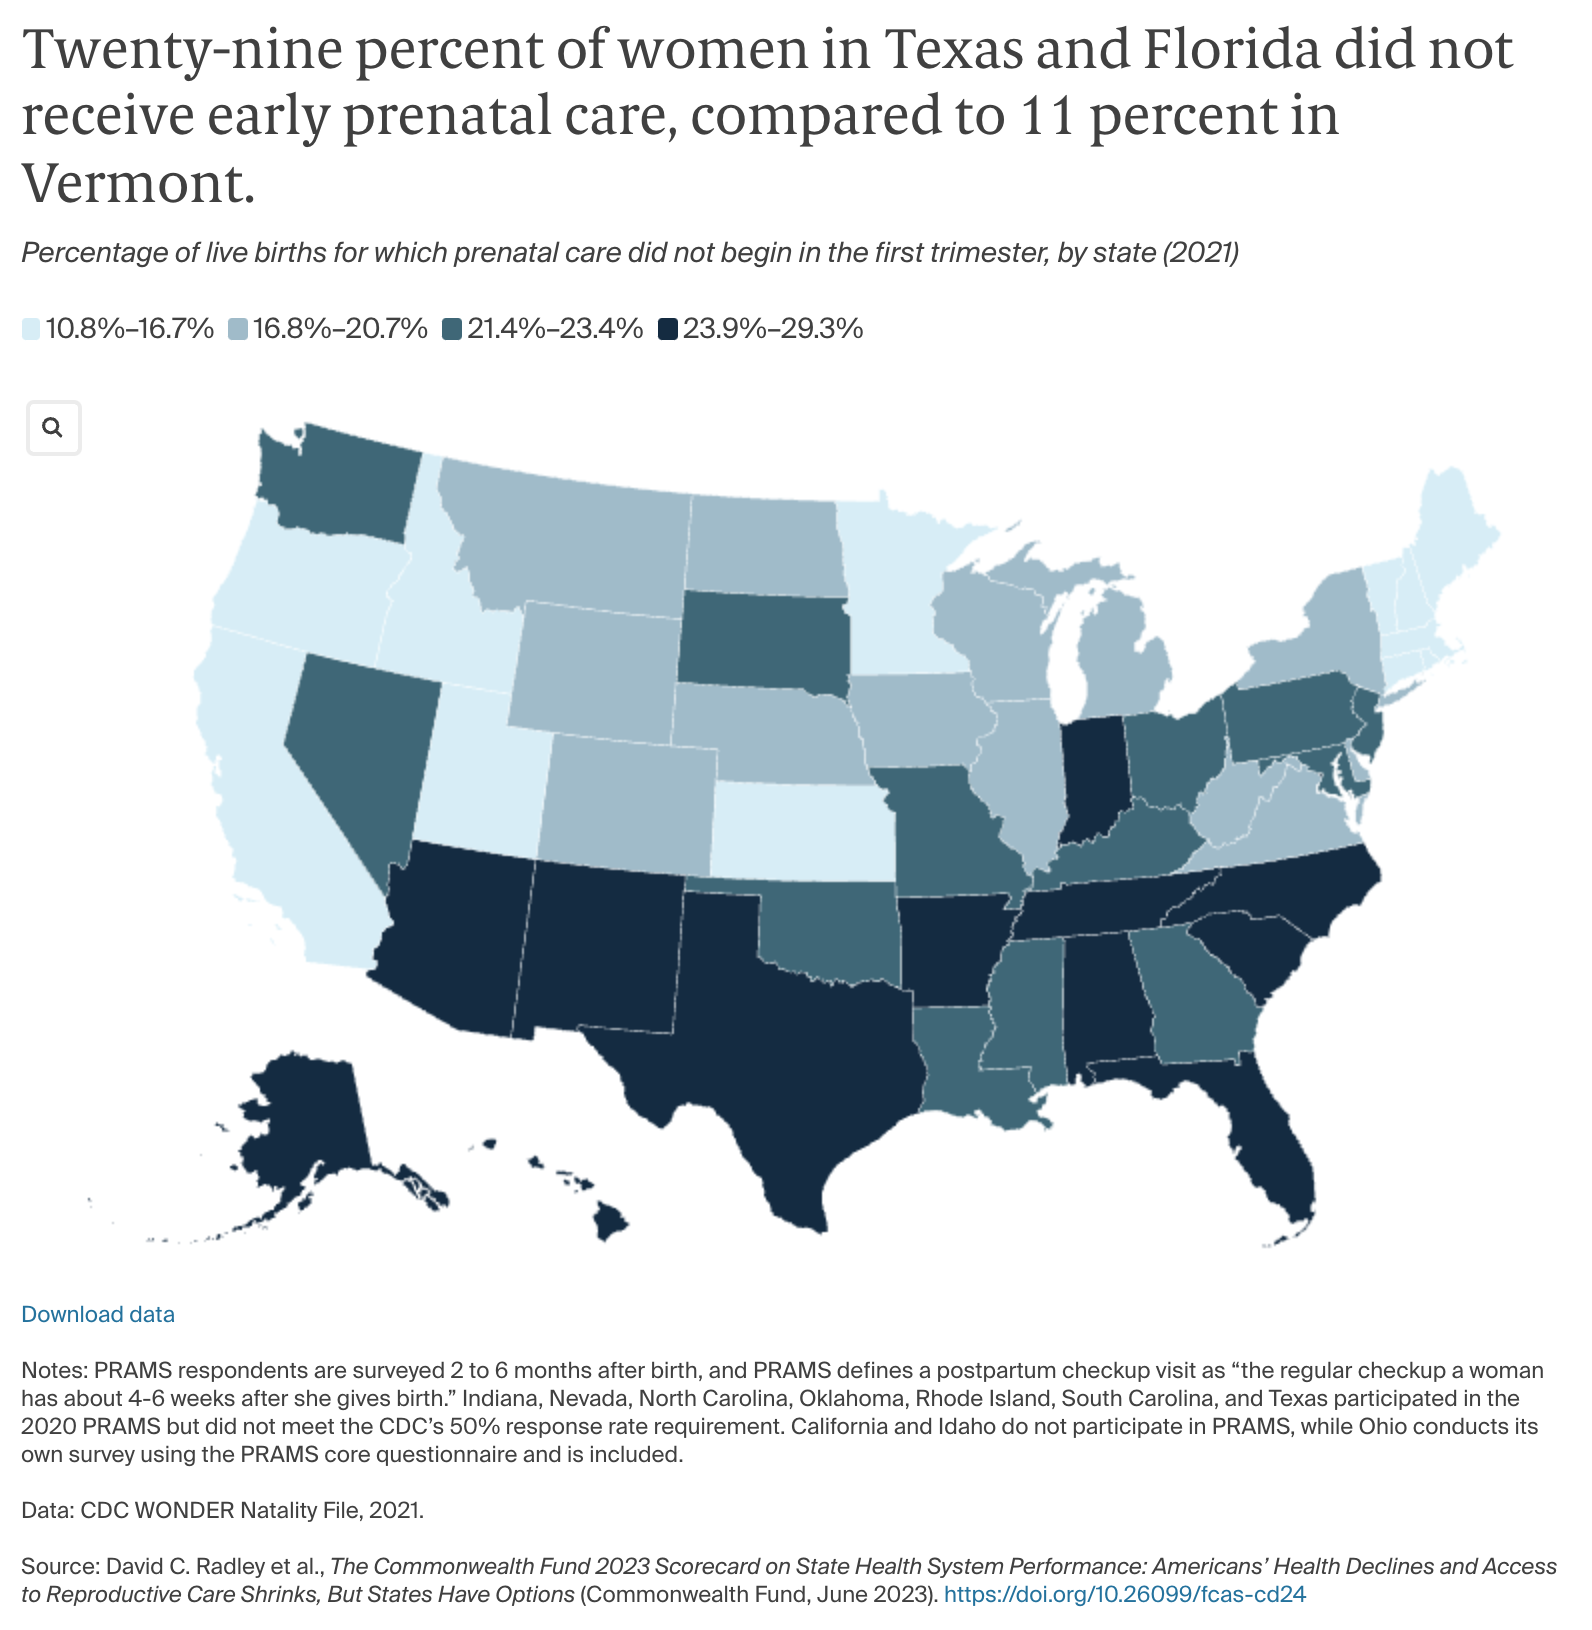
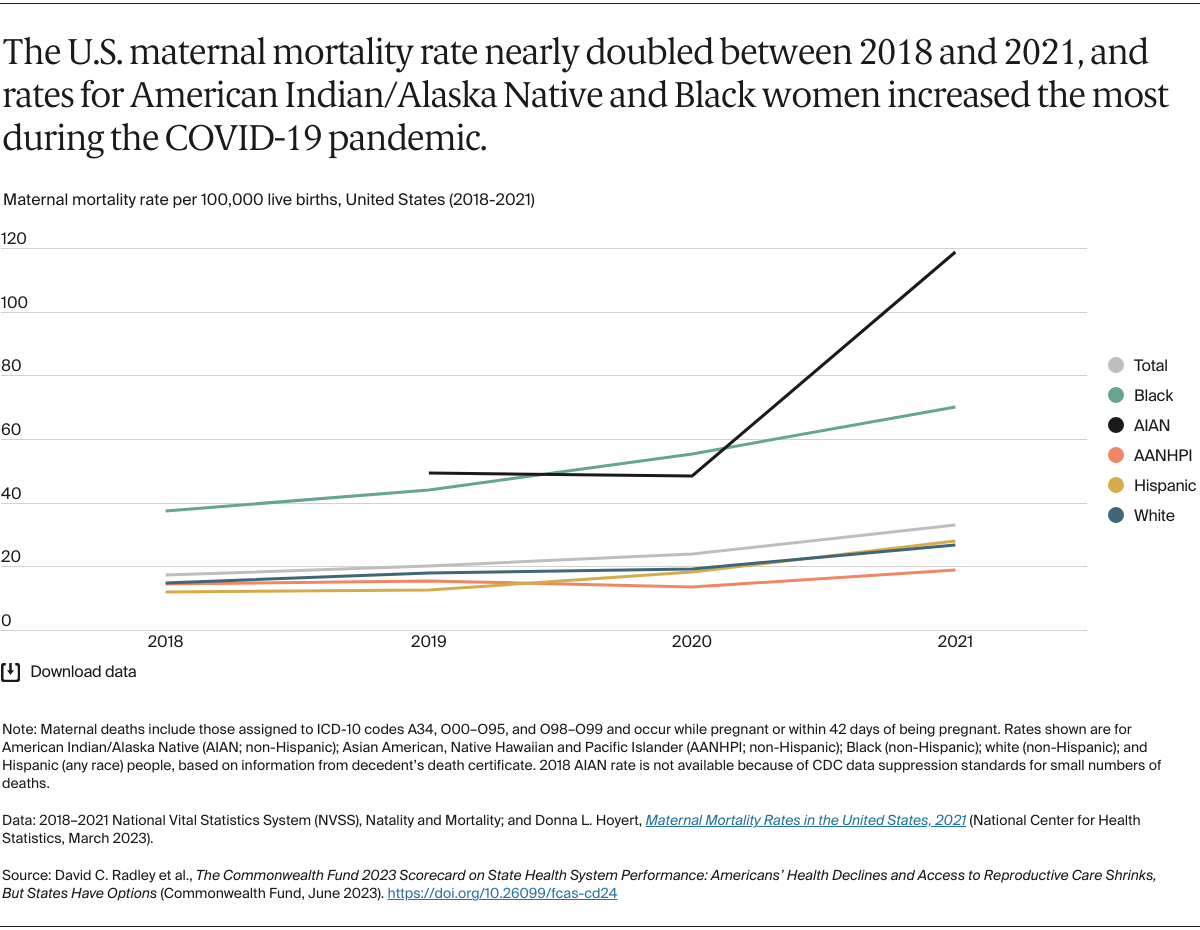
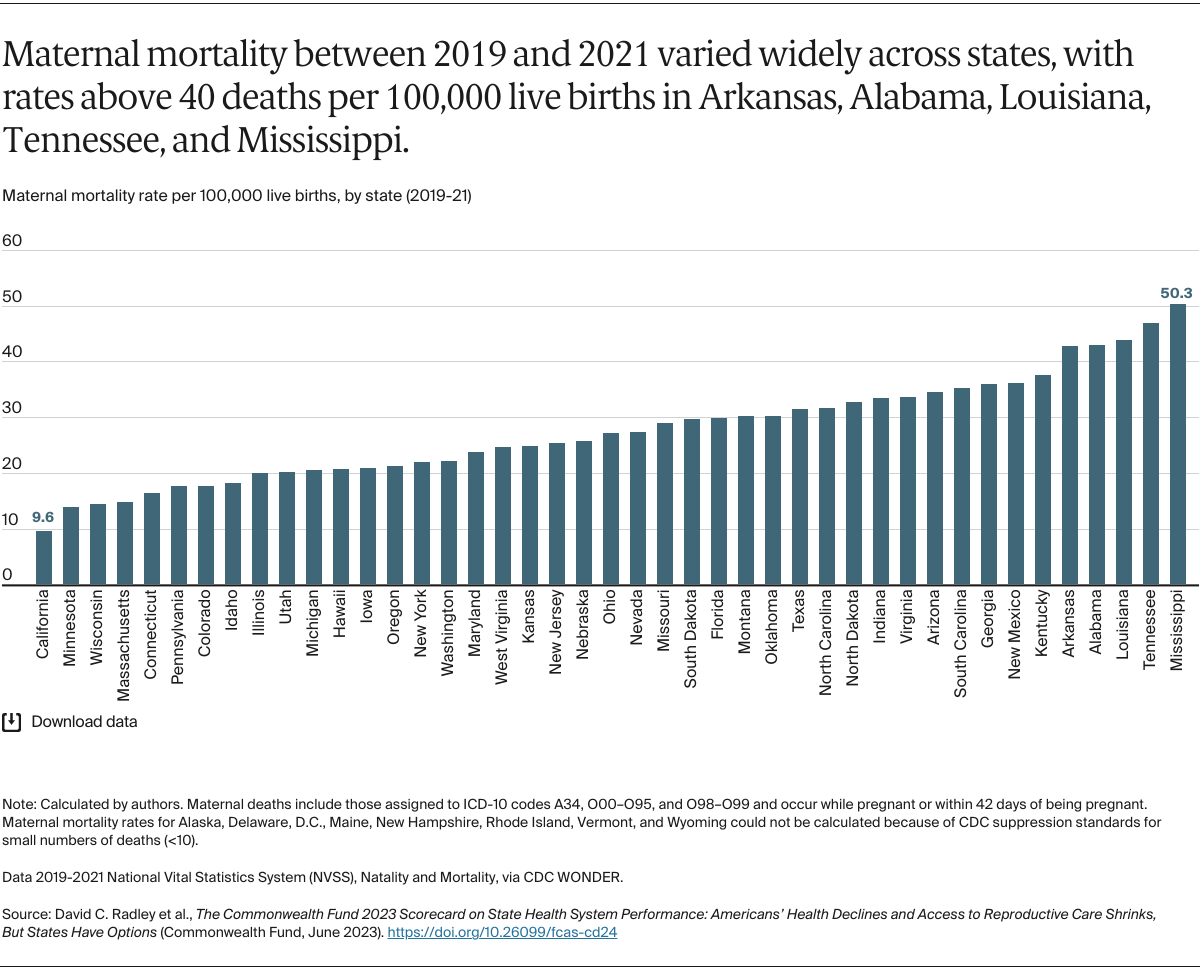
Reproductive Care and Women’s Health (12 indicators): includes measures to reflect health outcomes and access to important health services for women, mothers, and infants, including mortality, such as maternal and infant deaths; high-risk events, such as severe maternal morbidity and preterm births; and access to important health services, like routine checkups and prenatal or postpartum care. Certain measures in this domain have appeared in the Healthy Lives dimension (e.g. infant mortality, cancer deaths, maternal mortality) in previous scorecards. We include performance data for each of the 12 metrics in each state’s 2023 State Scorecard profile, along with data for different racial and ethnic groups on six of the metrics.

The development of this new dimension was made possible through collaboration with Dr. Laurie Zephryin of the Commonwealth Fund, along with helpful feedback from Dr. Eugene Declercq of Boston University and Kay Johnson of Dartmouth Medical School.

INCOME DISPARITY DIMENSION

This year, the State Scorecard reports on performance differences within states associated with individuals’ income level for 19 of the 49 indicators where data are available to support a population analysis by income; these indicators span four of the five dimensions. For most indicators, we measure the difference between rates for a state’s low-income population (generally less than 200% of the federal poverty level) and higher-income population (generally more than 400% of the federal poverty level). For elderly adult indicators built from Medicare claims (e.g., potentially avoidable emergency department visits age 65 and older), we measure the difference between beneficiaries who are dually eligible for Medicaid and those who are not. States are ranked on the magnitude of the resulting disparities in performance.

The income disparity indicators are different than those used in previous scorecards; hence, these disparity rankings are not strictly comparable to those published previously. For some indicators, we combined multiple years of data to ensure adequate sample sizes for stratified analysis.

RACIAL AND ETHNIC HEALTH EQUITY DIMENSION

As in 2022, the State Scorecard ranks states based on racial and ethnic health equity. To do this, the report uses updated data metrics and employs the same scoring method used in the Commonwealth Fund November 2021 report, Achieving Racial and Ethnic Equity in U.S. Health Care: A Scorecard of State Performance, to produce summary state health system performance scores for each of four racial and ethnic groups.

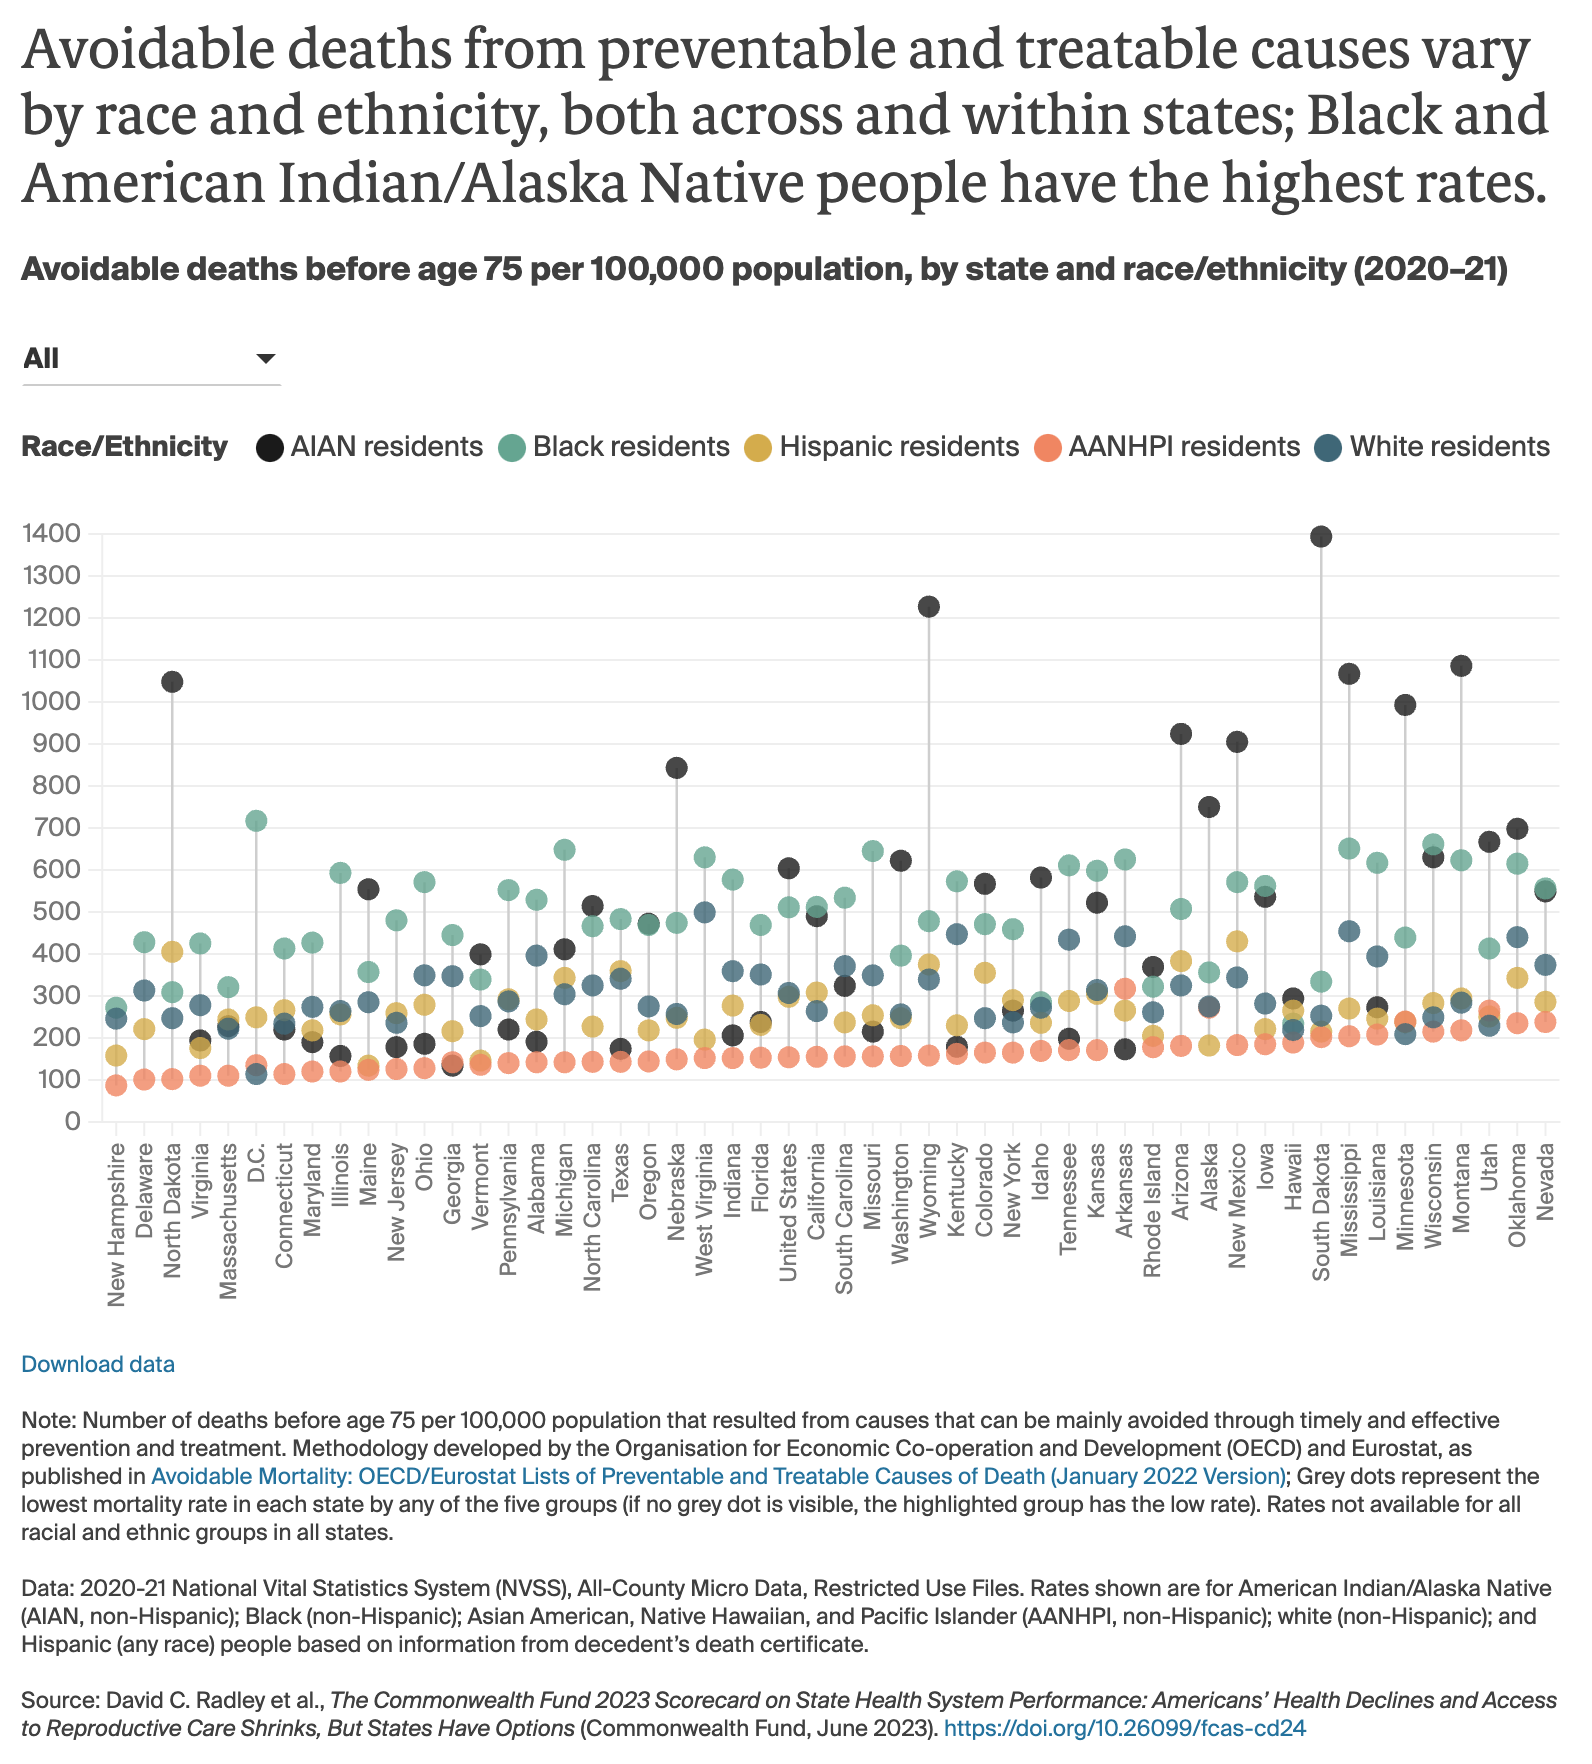
That report and method aggregates data on 25 performance indicators (reflecting health outcomes, health care access, and health care quality), stratified by race and ethnicity for Black (non-Hispanic), white (non-Hispanic), Hispanic (any race), American Indian/Alaska Native (AIAN, non-Hispanic), and Asian American, Pacific Islander, and Native Hawaiian (AANHPI, non-Hispanic) populations.

Each population group in each state receives a percentile score from 1 (worst) to 100 (best) reflecting the state’s overall health system performance for that group relative to all other population groups in all states. This enables comparisons within and across states. For example, a state health system score of 50 for Hispanic individuals in California indicates that the health system is performing better for those residents than Hispanic people in Texas, who have a score of 8, but worse than white residents in California, who have a score of 89.

The updated overall percentile scores for AIAN, AANHPI, Black, and Hispanic people are used in this year’s State Scorecard to reflect each state’s performance for non-white racial and ethnic groups. States were evaluated and ranked on their health system performance for each of the four groups separately (contingent on data availability), and those scores were then combined for the state’s final overall composite score. Summary scores for each group can be found in Appendix Table I1. State health system performance scores for white residents are included in the appendix for comparative purposes.

We also include performance data for each of the 25 metrics used in that equity report — updated to the most current year — in each state’s 2023 State Scorecard profile.

GUIDING PRINCIPLES

The following principles guided the development of the State Scorecard:

Performance Metrics. The 58 metrics selected for this report span health care system performance, representing important dimensions and measurable aspects of care delivery and population health. Where possible, indicators align with those used in previous scorecards. Several indicators used in previous versions of the State Scorecard have been dropped either because all states improved to the point where no meaningful variations existed (for example, measures that assessed hospitals on processes of care) or the data to construct the measures were no longer available (for example, hospitalizations for children with asthma). New indicators have been added to the State Scorecard series over time in response to evolving priorities or data availability (e.g., measures of COVID-19 vaccination status and medical debt).

Measuring Change over Time. We were able to track performance over time for 50 of the 58 indicators. Not all indicators could be trended because of changes in the underlying data or measure definitions, and some reflect newly collected data (e.g., COVID-19 vaccination).

For indicators where trends were possible, the baseline period generally reflects two to three years prior to the time of observation for the latest year of data available (often 2019), with the intent to use a baseline period prior to the emergence of COVID-19 in 2020. See Appendix Table A1 for baseline and current data years used in the report.

We considered a change in an indicator’s value between the baseline and current-year data points to be meaningful if it was at least one-half (0.5) of a standard deviation larger than the indicator’s combined distribution over the two time points — a common approach used in social science research. We did not formally evaluate change over time for indicators in the income or racial equity dimensions.

Data Sources. Indicators generally draw from publicly available data sources, including government-sponsored surveys, registries, publicly reported quality indicators, vital statistics, mortality data, and administrative databases. The most current data available were used in this report whenever possible. Appendix Table A1 provides detail on the data sources and time frames.

Scoring and Ranking Methodology. For each indicator, a state’s standardized z-score is calculated by subtracting the 51-state average (including the District of Columbia as if it were a state) from the state’s observed rate, and then dividing by the standard deviation of all observed state rates. States’ standardized z-scores are averaged across all available indicators within the performance dimension. States with missing values for a specific indicator are not assigned a z-score for that indicator, but are still assigned a dimension score based on their values for other indicators within the dimension. Dimension scores are averaged into an overall score, and ranks are assigned based on the overall score. This approach gives each dimension equal weight and, within each dimension, it weights all indicators equally. This method accommodates the different scales used across State Scorecard indicators (for example, percentages, dollars, and population-based rates).

As in previous scorecards, if historical data were not available for a particular indicator in the baseline period, the current-year data point was used as a substitute, thus ensuring that ranks in each time period were based on the same number of indicators.

REGIONAL COMPARISONS

The State Scorecard groups states into the eight regions used by the Bureau of Economic Analysis to measure and compare economic activity. The regions are: Great Lakes (Illinois, Indiana, Michigan, Ohio, Wisconsin); Mid-Atlantic (Delaware, District of Columbia, Maryland, New Jersey, New York, Pennsylvania); New England (Connecticut, Maine, Massachusetts, New Hampshire, Rhode Island, Vermont); Plains (Iowa, Kansas, Minnesota, Missouri, Nebraska, North Dakota, South Dakota); Rocky Mountain (Colorado, Idaho, Montana, Utah, Wyoming); Southeast (Alabama, Arkansas, Florida, Georgia, Kentucky, Louisiana, Mississippi, North Carolina, South Carolina, Tennessee, Virginia, West Virginia); Southwest (Arizona, New Mexico, Oklahoma, Texas); and West (Alaska, California, Hawaii, Nevada, Oregon, Washington).

Acknowledgements

We owe our sincere appreciation to all of the researchers who developed indicators and conducted data analyses for this scorecard. These include: Michael E. Chernew and Andrew Hicks, Department of Health Care Policy, Harvard Medical School; Sherry Glied and Dong Ding, New York University Robert F. Wagner Graduate School of Public Service; Emily Gadbois and Vincent Mor, Brown University; and Caitlin Burbank, Gulcan Cil, Snehapriya Yeddala, and Shreya Roy from the Center for Evidence-based Policy at Oregon Health & Science University. We acknowledge Mental Health America for data reported in The State of Mental Health in America; and the Urban Institute for data reported in Debt in America. We also thank Dr. Eugene Declercq of Boston University and Kay Johnson of Dartmouth Medical School for their feedback on data indicators for the new Reproductive Care and Women’s Health dimension and the report draft.

We would like to thank the following Commonwealth Fund staff members: Joseph Betancourt, Melinda Abrams, Rachel Nuzum, and Neil Powe for providing constructive feedback and guidance; and the Fund’s communications and support teams, including Barry Scholl, Chris Hollander, Deborah Lorber, Bethanne Fox, Josh Tallman, Jen Wilson, Paul Frame, Naomi Leibowitz, Aishu Balaji, Sam Chase, Jack Schiff, Relebohile Masitha, Arnav Shah, Evan Gumas, Alexandra Bryan, Sara Federman, Celli Horstman, Faith Leonard, and Munira Gunja for their guidance, editorial and production support, and public dissemination efforts.

Finally, the authors wish to acknowledge Maya Brod of Burness Communications for her assistance with media outreach, and the Center for Evidence-based Policy at Oregon Health & Science University for its support of the research unit, which enabled the analysis and development of the scorecard report.

NOTES
  1. Preventable mortality includes deaths before age 75 from causes that can generally be avoided through effective public health and primary prevention interventions. Examples of causes include measles, HIV/AIDS, and other infectious diseases; certain preventable cancers; personal injuries; and alcohol- and drug-related mortality. Treatable mortality includes deaths before age 75 from causes that can generally be avoided through timely and effective health care interventions. Examples of causes include diabetes (50%), heart disease (50%), appendicitis, certain types of cancer, and maternal mortality. Based on the methodology and categories developed by the Organisation for Economic Co-operation and Development: Avoidable Mortality: OECD/Eurostat Lists of Preventable and Treatable Causes of Death (Jan. 2022 version) (OECD, Jan. 2022).
  2. Thomas J. Bollyky et al., “Assessing COVID-19 Pandemic Policies and Behaviours and Their Economic and Educational Trade-Offs Across U.S. States from Jan. 1, 2020, to July 31, 2022: An Observational Analysis,” The Lancet 401, no. 10385 (Apr. 22, 2023): 1341–60.
  3. John Gramlich, What the Data Says About Gun Deaths in the U.S. (Pew Research Center, Apr. 26, 2023); Janie Boschma, Curt Merrill, and John Murphy-Teixidor, “Mass Shootings in the US: Fast Facts,” CNN, May 4, 2023; and Evan D. Gumas, Munira Z. Gunja, and Reginald D. Williams II, “The Health Costs of Gun Violence: How the U.S. Compares to Other Countries,” chartpack, Commonwealth Fund, Apr. 2023.
  4. Chad Terhune and Robin Respaut, “U.S. Diabetes Deaths Top 100,000 for Second Straight Year,” Reuters, Jan. 31, 2022; and Alexander Tin, “Heart-Related Deaths Rose Sharply During First Year of COVID-19 Pandemic, Report Shows,” CBS News, Jan. 25, 2023.
  5. Elizabeth Arias et al., “U.S. State Life Tables, 2020,” National Vital Statistics Reports 71, no. 2 (Aug. 23, 2022).
  6. Elizabeth Arias et al., “Provisional Life Expectancy Estimates for 2021,” National Vital Statistics Rapid Release, no. 23 (Aug. 2022).
  7. Benedict I. Truman, Man-Huei Chang, and Ramal Moonesinghe, “Provisional COVID-19 Age-Adjusted Death Rates, by Race and Ethnicity — United States, 2020–2021,” Morbidity and Mortality Weekly Report 71, no. 17 (Apr. 29, 2022): 601–5; Quanhe Yang et al., “Stroke Mortality Among Black and White Adults Aged ≥35 Years Before and During the COVID-19 Pandemic — United States, 2015–2021,” Morbidity and Mortality Weekly Report 72, no. 16 (Apr. 21, 2023): 431–36; and Stephen Sidney et al., “Age-Adjusted Mortality Rates and Age and Risk–Associated Contributions to Change in Heart Disease and Stroke Mortality, 2011–2019 and 2019–2020,” JAMA Network Open 5, no. 3 (Mar. 2022): e223872.
  8. Courtnee Melton-Fant, “Health Equity and the Dynamism of Structural Racism and Public Policy,” Milbank Quarterly 100, no. 3 (Sept. 2022): 628–49.
  9. Authors’ analysis of CDC WONDER Database (Wide-Ranging Online Data for Epidemiologic Research).
  10. Matt Richtel, “The Surgeon General’s New Mission: Adolescent Mental Health,” New York Times, Mar. 21, 2023.
  11. Centers for Disease Control and Prevention, “CDC Report Shows Concerning Increases in Sadness and Exposure to Violence Among Teen Girls and LGBQ+ Youth,” news release, Mar. 9, 2023.
  12. Mental Health America, The State of Mental Health in America: 2023.
  13. Guttmacher Institute, “Interactive Map: U.S. Abortion Policies and Access After Roe,” updated June 13, 2023; and “Tracking the States Where Abortion Is Now Banned,” New York Times, updated June 5, 2023.
  14. Sarah Varney, “After Idaho’s Strict Abortion Ban, OB-GYNs Stage a Quick Exodus,” KFF Health News, May 2, 2023; Eric Boodman, “Legal at One Clinic, Illegal at Another: How Abortion Bans Make Gestational Age Even Less Precise,” STAT, Nov. 10, 2022; and Arielle Dreher and Oriana González, “New Doctors Avoid Residencies in States with Abortion Bans,” Axios, Apr. 18, 2023.
  15. Laurie C. Zephyrin and David Blumenthal, “The Loss of Abortion Rights Will Send Shockwaves Through the U.S. Health Care System,” To the Point (blog), Commonwealth Fund, June 24, 2022; and Fabiola Cineas, “Black Women Will Suffer the Most Without Roe,” Vox, June 29, 2022.
  16. Marie E. Thoma and Eugene R. Declercq, “All-Cause Maternal Mortality in the US Before vs During the COVID-19 Pandemic,” JAMA Network Open 5, no. 6 (June 2022): e2219133.
  17. Marie E. Thoma and Eugene R. Declercq, “Changes in Pregnancy-Related Mortality Associated with the Coronavirus Disease 2019 (COVID-19) Pandemic in the United States,” Obstetrics & Gynecology 141, no. 5 (May 1, 2023): 911–17.
  18. Karen Wang, Derek Kravitz, and Dillon Bergin, “New CDC and State Data Shows How the COVID-19 Pandemic Led to a Startling Rise in Maternal Deaths,” MuckRock, Mar. 8, 2023; Jodie G. Katon et al., Policies for Reducing Maternal Morbidity and Mortality and Enhancing Equity in Maternal Health: A Review of the Evidence (Commonwealth Fund, Nov. 2021); and authors’ analysis of CDC WONDER.
  19. Elizabeth A. Howell et al., “Race and Ethnicity, Medical Insurance, and Within-Hospital Severe Maternal Morbidity Disparities,” Obstetrics and Gynecology 135, no. 2 (Feb. 2020): 285–93; and Elizabeth A. Howell and Jennifer Zeitlin, “Improving Hospital Quality to Reduce Disparities in Severe Maternal Morbidity and Mortality,” Seminars in Perinatology 41, no. 5 (Aug. 2017): 266–72.
  20. Meghan Bellerose, Mariela Rodriguez, and Patrick Vivier, “A Systematic Review of the Qualitative Literature on Barriers to High-Quality Prenatal and Postpartum Care Among Low-Income Women,” Health Services Research 57, no. 4 (Aug. 2022): 775–85; Denisse S. Holcomb et al., “Geographic Barriers to Prenatal Care Access and Their Consequences,” American Journal of Obstetrics & Gynecology MFM 3, no. 5 (Sept. 2021): 100442; and Nowhere to Go: Maternity Care Deserts Across the U.S. (March of Dimes, Oct. 2022).
  21. Strong Start for Mothers and Newborns Initiative: Evaluation of Full Performance Period (2018) (CMS Center for Medicare and Medicaid Innovation); and Arden Handler and Kay Johnson, “A Call to Revisit the Prenatal Period as a Focus for Action Within the Reproductive and Perinatal Care Continuum,” Maternal and Child Health Journal 20, no. 11 (Sept. 2016): 2217–27.
  22. Eugene Declercq and Laurie C. Zephyrin, Maternal Mortality in the United States: A Primer (Commonwealth Fund, Dec. 2020); Munira Z. Gunja et al., Health and Health Care for Women of Reproductive Age: How the United States Compares with Other High-Income Countries (Commonwealth Fund, Apr. 2022); Munira Z. Gunja, Evan D. Gumas, and Reginald D. Williams II, “The U.S. Maternal Mortality Crisis Continues to Worsen: An International Comparison,” To the Point (blog), Commonwealth Fund, Dec. 1, 2022; and Donna L. Hoyert, Maternal Mortality Rates in the United States, 2021 (National Center for Health Statistics, Mar. 2023).
  23. Martha Hostetter, Sarah Klein, and Laurie C. Zephyrin, Maternity Care, Interrupted: As the U.S. Is Jolted by COVID-19, So Too Is the Traditional Model of Delivering Maternity Care (Commonwealth Fund, May 2020).
  24. Maternal Health: Outcomes Worsened and Disparities Persisted During the Pandemic (U.S. Government Accountability Office, Oct. 2022).
  25. Hoyert, Maternal Mortality Rates, 2023; authors’ calculations using CDC natality and mortality files; Thoma and Declercq, “Changes in Pregnancy-Related Mortality,” 2023.
  26. GAO, Maternal Health: Outcomes Worsened, 2022.
  27. Diana Crumley, How California’s Medi-Cal Program Aims to Advance Health Equity for Pregnant People (Center for Health Care Strategies, July 2022).
  28. Guttmacher Institute, “Interactive Map,” 2023.
  29. Eugene Declercq et al., The U.S. Maternal Health Divide: The Limited Maternal Health Services and Worse Outcomes of States Proposing New Abortion Restrictions (Commonwealth Fund, Dec. 2022).
  30. Centers for Medicare and Medicaid Services, January 2023 Medicaid and CHIP Enrollment Trends Snapshot.
  31. Centers for Medicare and Medicaid Services, “Access to Health Coverage.”
  32. Office of the Assistant Secretary for Planning and Evaluation, Unwinding the Medicaid Continuous Enrollment Provision: Projected Enrollment Effects and Policy Approaches (U.S. Department of Health and Human Services, Aug. 19, 2022); and Caroline Hanson et al., “Health Insurance for People Younger Than Age 65: Expiration of Temporary Policies Projected to Reshuffle Coverage, 2023–33,” Health Affairs 42, no. 6 (June 2023): 742–52.
  33. Sara Rosenbaum et al., “Unwinding Continuous Medicaid Enrollment,” New England Journal of Medicine 388, no. 12 (Mar. 23, 2023): 1061–63; and Usha Ranji, Jennifer Tolbert, and Ivette Gomez, “Postpartum Individuals Are at Risk of Losing Medicaid During the Unwinding of the Medicaid Continuous Enrollment Provision, Especially in Certain States,” Henry J. Kaiser Family Foundation, May 30, 2023.
  34. Sara R. Collins, Lauren A. Haynes, and Relebohile Masitha, The State of U.S. Health Insurance in 2022: Findings from the Commonwealth Fund Biennial Health Insurance Survey (Commonwealth Fund, Sept. 2022).
  35. Consumer Financial Protection Bureau, Medical Debt Burden in the United States (CFPB, Feb. 2022).
  36. Sara R. Collins, David C. Radley, and Jesse C. Baumgartner, State Trends in Employer Premiums and Deductibles, 2010–2020 (Commonwealth Fund, Jan. 2022).
  37. Yalda Jabbarpour et al., The Health of US Primary Care: A Baseline Scorecard Tracking Support for High-Quality Primary Care (Milbank Memorial Fund, Feb. 2023); and Atul Gawande, “The Aftermath of a Pandemic Requires as Much Focus as the Start,” New York Times, Mar. 16, 2023.
  38. Nathaniel Counts and Rachel Nuzum, “What Policymakers Can Do to Address Our Behavioral Health Crisis,” To the Point (blog), Commonwealth Fund, Sept. 21, 2022.
  39. Improving Behavioral Health Care for Youth Through Collaborative Care Expansion (Meadows Mental Health Policy Institute, May 2023).
  40. Jesse C. Baumgartner and Celli Horstman, “Changing the Way Opioid Addiction Treatment Is Delivered Could Reduce Death and Suffering,” To the Point (blog), Commonwealth Fund, Oct. 24, 2022.
  41. Charlie Severance-Medaris, “As Opioid Overdoses Surge, States Expand Treatment,” National Conference of State Legislatures, May 17, 2022.
  42. Jesse C. Baumgartner and David C. Radley, “Overdose Deaths Declined but Remained Near Record Levels During the First Nine Months of 2022 as States Cope with Synthetic Opioids,” To the Point (blog), Commonwealth Fund, Mar. 13, 2023.
  43. Medicaid Postpartum Coverage Extension Tracker,” Henry J. Kaiser Family Foundation, June 15, 2023.
  44. Sara Rosenbaum et al., “The Road to Maternal Health Runs Through Medicaid Managed Care,” To the Point (blog), Commonwealth Fund, May 22, 2023; and Shanoor Seervai et al., “Limiting Abortion Access for American Women Impacts Health, Economic Security: An International Comparison,” To the Point (blog), Commonwealth Fund, Jan. 12, 2023.
  45. Declercq et al., The U.S. Maternal Health Divide, 2022; and Katon et al., Policies for Reducing Maternal Morbidity and Mortality, 2021.
  46. Gunja et al., Health and Health Care for Women of Reproductive Age, 2022; and Katon et al., Policies for Reducing Maternal Morbidity and Mortality, 2021.
  47. Chapter 6: Substance Use Disorder and Maternal and Infant Health,” in Report to Congress on Medicaid and CHIP (Medicaid and CHIP Payment and Access Commission, June 2020); “Substance Use Disorder Treatment in Pregnant and Parenting Women: Integrated Care Models,” CLOUD Library, Center for Evidence-based Policy, May 12, 2020; and Maggie Clark, “Maternal Mental Health Month Shines Light on Need for Policy Solutions,” Say Ahhh! (blog), Georgetown University Health Policy Institute, Center for Children and Families, May 25, 2023.
  48. Eileen Wang et al., “Social Determinants of Pregnancy-Related Mortality and Morbidity in the United States: A Systematic Review,” Obstetrics and Gynecology 135, no. 4 (Apr. 2020): 896–915.
  49. Elizabeth Lower-Basch and Stephanie Schmit, TANF and the First Year of Life: Making a Difference at a Pivotal Moment (Center for Law and Social Policy, Oct. 2015); and Heather D. Hill, “Welfare as Maternity Leave? Exemptions from Welfare Work Requirements and Maternal Employment,” Social Service Review 86, no. 1 (Mar. 2012): 37–67.
  50. Sara Rosenbaum, “Expanding Health Coverage to the Poorest Residents of States That Have Not Expanded Medicaid,” To the Point (blog), Commonwealth Fund, Feb. 1, 2022.
  51. Sara R. Collins and Lauren A. Haynes, “Congress Can Give States the Option to Keep Adults Covered in Medicaid,” To the Point (blog), Commonwealth Fund, Nov. 14, 2022.
  52. The approach would treat all legal residents as insured 12 months a year regardless of enrollment in a health plan. Income-related premiums would be collected through the tax system. See Linda J. Blumberg, John Holahan, and Jason Levitis, How Auto-Enrollment Can Achieve Near-Universal Coverage: Policy and Implementation Issues (Commonwealth Fund, June 2021).
  53. A bill introduced by Senator Jeanne Shaheen (D–N.H.) would raise the cost-protection of the marketplace benchmark plan and make more people eligible for cost-sharing subsidies (Improving Health Insurance Affordability Act of 2021, S. 499, 117th Cong. (2021), S. Doc. 1–6). This could eliminate deductibles for some people and reduce them for others by as much as $1,650 a year. See Linda J. Blumberg et al., From Incremental to Comprehensive Health Insurance Reform: How Various Reform Options Compare on Coverage and Costs (Urban Institute, Oct. 2019); and Jesse C. Baumgartner, Munira Z. Gunja, and Sara R. Collins, The New Gold Standard: How Changing the Marketplace Coverage Benchmark Could Impact Affordability (Commonwealth Fund, Sept. 2022).
  54. John Holahan and Michael Simpson, Next Steps in Expanding Health Coverage and Affordability: What Policymakers Can Do Beyond the Inflation Reduction Act (Commonwealth Fund, Sept. 2022); Rosenbaum, “Expanding Health Coverage,” 2022; and John Holahan et al., Filling the Gap in States That Have Not Expanded Medicaid Eligibility (Commonwealth Fund, June 2021, updated Oct. 5, 2021).
  55. Choose Medicare Act, H.R.5011, 117th Cong. (2021), H.R. Doc. 1–32; Medicare-X Choice Act of 2021, H.R.1227, 117th Cong. (2021), H.R. Doc. 1–24; Medicare-X Choice Act of 2021, S.386, 117th Cong. (2021), S. Doc. 1–25; State Public Option Act, H.R.4974, 117th Cong. (2021), H.R. Doc. 1–27; State Public Option Act, S.2639, 117th Cong. (2021), S. Doc. 1–27; Public Option Deficit Reduction Act, H.R.2010, 117th Cong. (2021), H.R. Doc. 1–17; CHOICE Act, S.983, 117th Cong. (2021), S. Doc. 1–12; Health Care Improvement Act of 2021, S.352, 117th Cong. (2021), S. Doc. 1–75; State-Based Universal Health Care Act of 2021, H.R.3775, 117th Cong. (2021), H.R. Doc. 1–30; Christine H. Monahan, Justin Giovannelli, and Kevin Lucia, “HHS Approves Nation’s First Section 1332 Waiver for a Public Option Plan in Colorado,” To the Point (blog), Commonwealth Fund, July 12, 2022; Christine H. Monahan, Justin Giovannelli, and Kevin Lucia, “Update on State Public Option-Style Laws: Getting to More Affordable Coverage,” To the Point (blog), Commonwealth Fund, Mar. 29, 2022; and Ann Hwang et al., State Strategies for Slowing Health Care Cost Growth in the Commercial Market (Commonwealth Fund, Feb. 2022).
  56. The Biden Administration Announces New Actions to Lesson the Burden of Medical Debt and Increase Consumer Protection, fact sheet, The White House, Apr. 11, 2022.
  57. Chi Chi Wu, Jenifer Bosco, and April Kuehnhoff, Model Medical Debt Protection Act (National Consumer Law Center, Sept. 2019); and Christopher T. Robertson, Mark Rukavina, and Erin C. Fuse Brown, “New State Consumer Protections Against Medical Debt,” JAMA 327, no. 2 (Jan. 11, 2022): 121–22.
  58. Adam Liptak, “In Abortion Pill Ruling, the Supreme Court Trades Ambition for Prudence,” New York Times, Apr. 22, 2023.

Publication Details

Date

Contact

David C. Radley, Senior Scientist, Tracking Health System Performance, The Commonwealth Fund

[email protected]

Citation

David C. Radley et al., The Commonwealth Fund 2023 Scorecard on State Health System Performance: Americans’ Health Declines and Access to Reproductive Care Shrinks, But States Have Options (Commonwealth Fund, June 2023). https://doi.org/10.26099/fcas-cd24