
Advanced Search

Advanced Search

Current Filters

Filter your query

Publication Types

Other

to

Fund Reports

/

State Trends in Employer Premiums and Deductibles, 2010–2020

Woman sits at table with laptop and book out in front of her in her home
Toplines
  • Employer health coverage fell only slightly during the pandemic, but U.S. median family incomes are not keeping pace with rising health plan costs and deductibles

  • In 2020, health insurance premium and deductible costs together consumed 11.6 percent of median U.S. household income, compared to 9.1 percent in 2010

Introduction

More than a decade after passage of the Affordable Care Act (ACA), employer health insurance coverage remains the backbone of health insurance in the United States, covering more than half of Americans under age 65 — about 163 million people.1 This coverage has proved to be resilient in the COVID-19 pandemic.

Only about 6 percent of working-age adults reported losing their employer insurance during the pandemic-induced recession.2 Among those who did lose job-based coverage, fewer became uninsured compared to during prior recessions. This is because the ACA’s marketplace subsidies and expansion in Medicaid eligibility provided a safety net for those without access to another employer plan or COBRA.

The key issue for many workers and their families is the affordability of their premium contributions and the cost protections provided by their employer health plan, including the size of their deductibles. Focusing on middle-income people enrolled in employer plans, we examined the most recent data from the federal Medical Expenditure Panel Survey–Insurance Component to answer these questions3:

  • How much are workers spending on premiums and and what is the size of their deductibles?
  • How do these costs compare to the median income in each state? 

Highlights

  • Premium contributions and deductibles in employer health plans accounted for 11.6 percent of median household income in 2020, up from 9.1 percent a decade earlier.
  • In 37 states, premium contributions and deductibles amounted to 10 percent or more of median income in 2020, up from 10 states in 2010.
  • Middle-income workers in Mississippi and New Mexico faced the highest potential costs relative to income, 19 percent and 18 percent, respectively.
  • The total cost of premiums plus potential spending on deductibles ranged from a low of $6,528 in Hawaii to a high of more than $9,000 in Florida, Kansas, Missouri, South Dakota, and Texas.
Line graph demonstrating the upward slope of premium contributions and deductibles from 2010 to 2020

Over the past decade, premium contributions and deductibles for employer plans have represented a growing share of workers’ incomes. Those costs accounted for 11.6 percent of the U.S. median household income in 2020, up from 9.1 percent in 2010 (Table 1).

On average, the employee share of premium costs amounted to 6.9 percent of median income in 2020. This was up from 5.8 percent in 2010, though the share has remained largely constant since 2017.

The average deductible for a middle-income household amounted to 4.7 percent of its income. In 2010, that share was 3.3 percent.

3 maps demonstrating how more stats have worker insurance premium contributions and deductibles that make up 10 percent or more of median income in 2020 than in 2010

Premium contributions and deductibles represented 10 percent or more of median household income in 37 states in 2020, up from 10 states in 2010 (Table 1). In Mississippi and New Mexico, workers in the middle of the income distribution faced the highest potential costs relative to income (19.0% and 18.1%, respectively).

Added together, the average total cost of premiums and potential spending on deductibles across single and family insurance policies climbed to $8,070 in 2020 (Table 2). This ranged from a low of $6,528 in Hawaii to a high of more than $9,000 in Florida, Kansas, Missouri, South Dakota, and Texas.

Bar chart detailing the premium contributions for each state

In 2020, U.S. workers enrolled in employer coverage were responsible for paying about 21 percent of their overall premium for single coverage (Table 3). This amounted to an average of $1,532 nationally, and ranged from $852 in Hawaii to $1,895 in South Carolina (Table 4a).

Bar chart detailing the premium contributions for family coverage for each state

Workers in family plans pay a somewhat larger share of their premium: 29 percent on average (Table 3). But in four states (Florida, Louisiana, Mississippi, and Nevada), workers were responsible for 37 percent or more of their family premium. These percentages translated to an average of $5,978 nationally, and ranged from $4,610 in Washington to $7,674 in Florida (Table 4b).

Map of United States showing that premium contributions were more than 8.5 percent of median income in eight states

Premium contributions were more than 8.5 percent of median income in Florida, Louisiana, Mississippi, Nevada, New Mexico, Oklahoma, South Carolina, and Texas. The high was 12.7 percent, in Mississippi (Table 1). In 2010, in only one state, Mississippi, were middle-income people spending so much of their household earnings on employer premiums.

Bar chart showing that family premium contributions by workers in lower-wage firms were higher than those for workers in higher-wage firms

Workers in firms with lower average wages contributed a larger share of their overall premium for family coverage, and consequently a larger dollar amount, on average, than workers in firms with higher average wages. This differential was also evident for single-person coverage (data not shown). While workers in small firms on average contribute a larger share of family plan premiums than workers in large firms, other research indicates that this pattern is evident in both small and large firms.4

Bar chart showing every state and that deductibles for single coverage ranged from $1,346 in Hawaii to $2,517 in Montana

Even while many workers are paying high premiums relative to their income, they also face large deductibles. Research indicates that high deductibles can act as a financial barrier to care, discouraging people with modest incomes from getting needed services.5 In 2020, the average deductible for single-person policies was $1,945, and ranged as high as $2,517 in Montana (Table 5).

Map of U.S. showing that average deductibles amounted to 5 percent or more of median income in 22 states

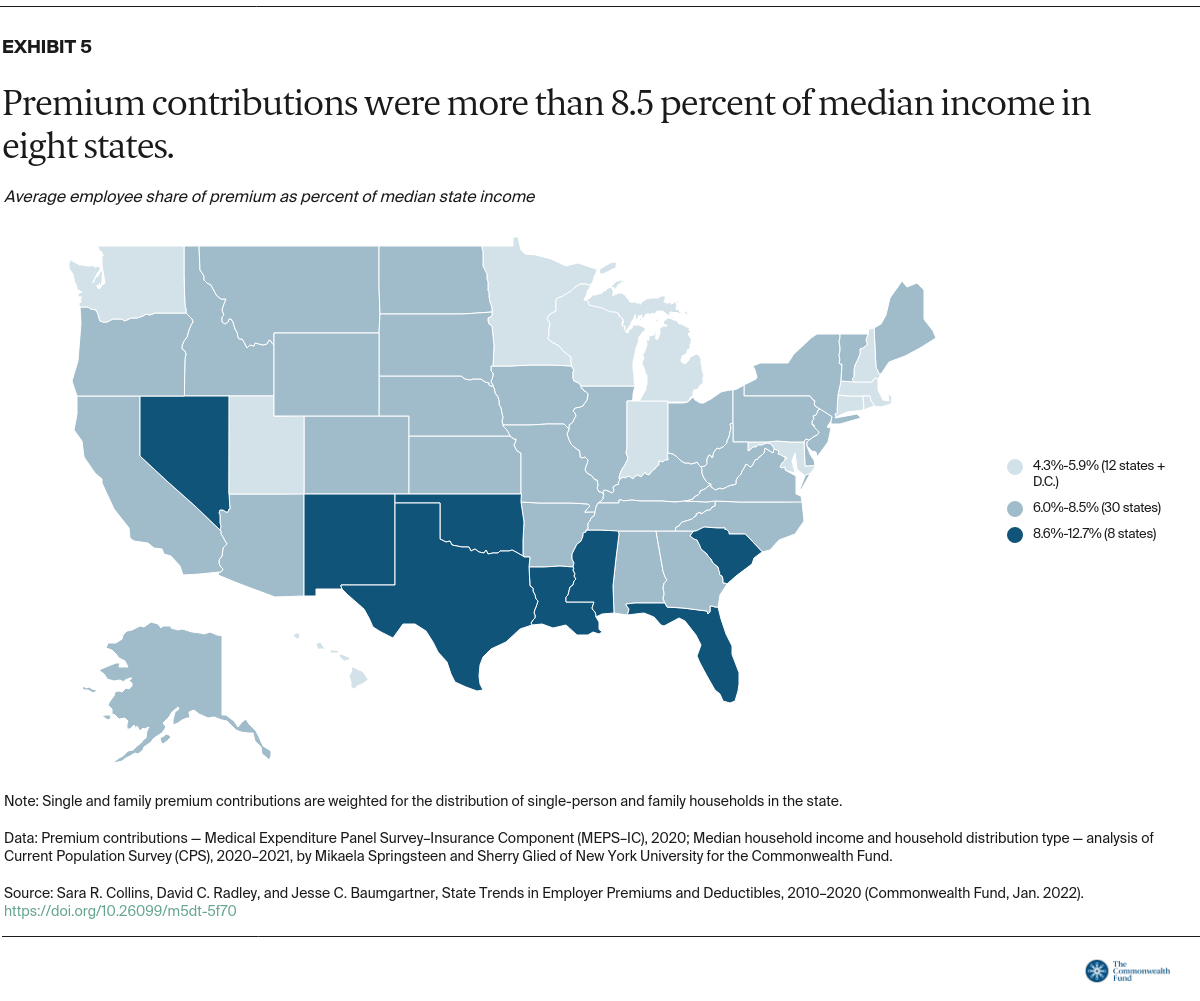
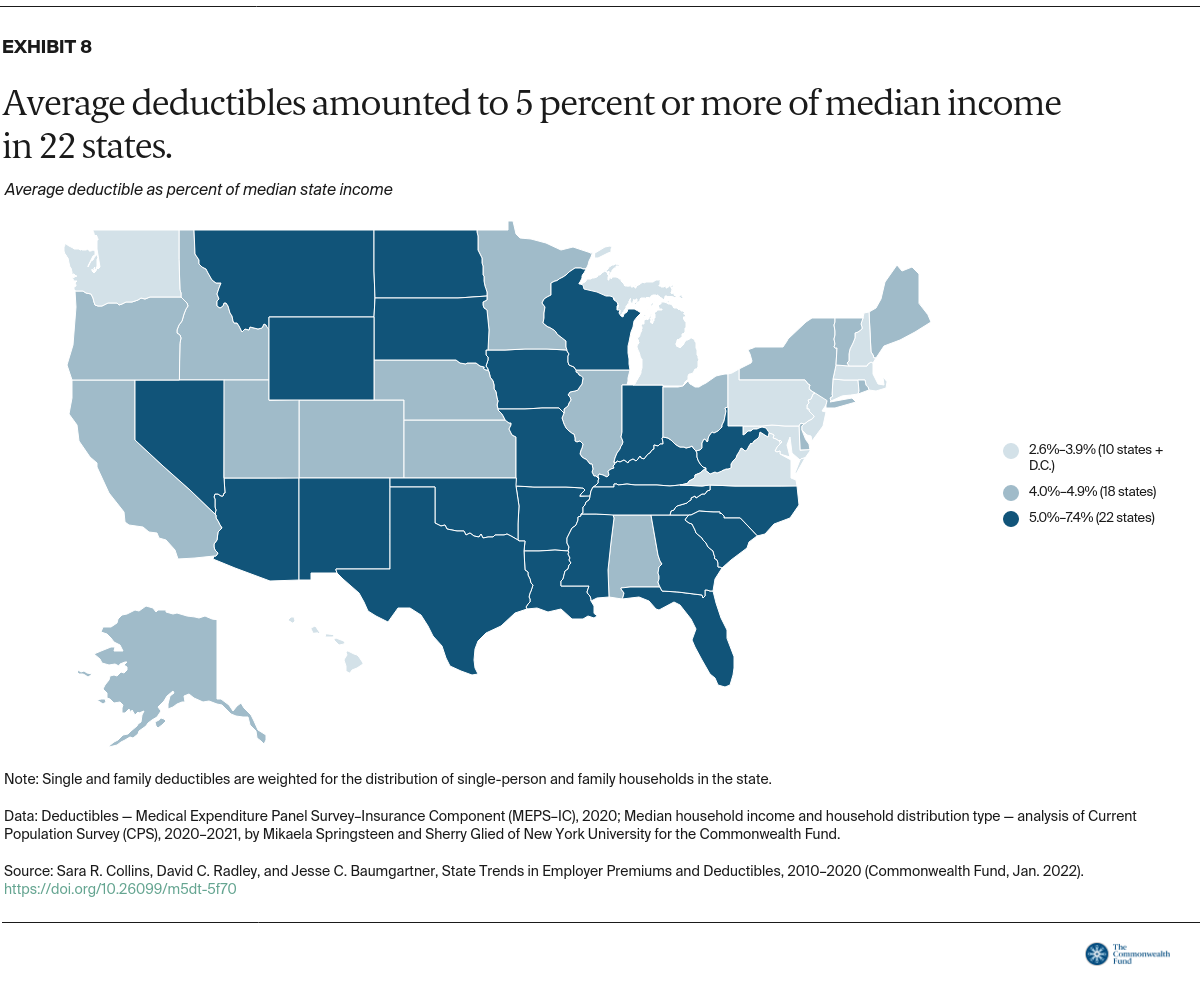
The Commonwealth Fund tracks the share of people with health coverage who are underinsured, meaning their plan does not provide adequate protection from high out-of-pocket costs and deductibles, excluding premiums.6 A deductible that accounts for 5 percent or more of household income is one of our threshold measures of being underinsured.

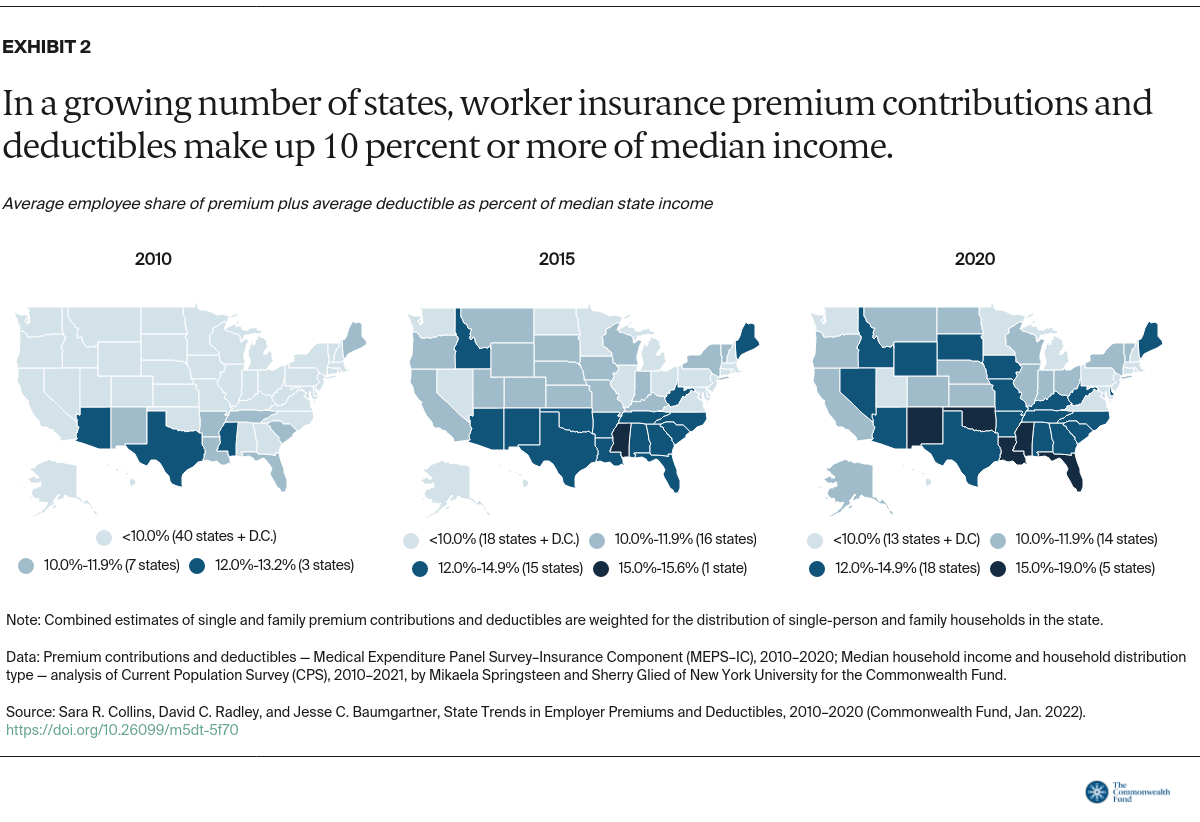
In nearly half the states, people at the midrange of the income distribution faced average deductibles that left them underinsured in 2020. In 2010, workers in just one state faced an average deductible that met that threshold.

The highest average deductible relative to median income in 2020 was 7.4 percent, in New Mexico (Table 1).

The Growing Cost of Health Insurance for America’s Middle Class

The growing cost of employer health insurance is driven by the growth in health care spending. New data from the Health Care Cost Institute show that spending per person in employer plans grew by nearly 22 percent over the period 2015 to 2019, outpacing both inflation and economic growth.7 Prices commanded by health care providers and drug companies were the primary driver, accounting for nearly two-thirds of overall spending growth.

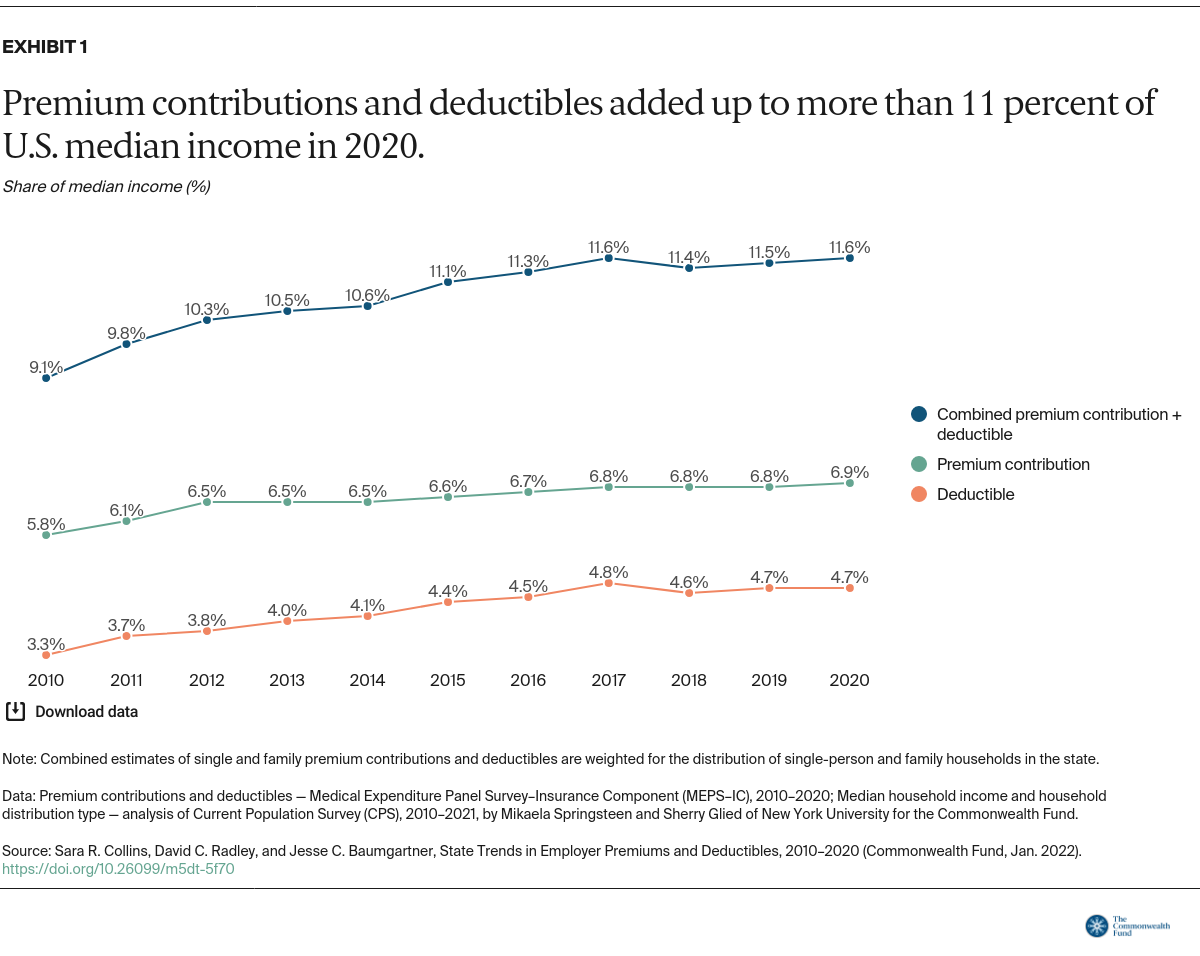
These high prices are the main reason why the amount that workers pay for their premiums and deductibles has grown over time. And because incomes have not kept pace, health insurance is taking up a larger and larger percentage of household budgets. To make matters worse, workers are making wage concessions for company benefits that often cover less of their health care costs.

These costs add to the financial burden U.S. families are already facing. Housing and food consumed 34 percent of average family income in 2020.8 Among families with children under age 5, average spending on childcare took up 13 percent of family income in 2017.9

Health care cost burdens are both an impediment to families’ ability to get timely health care and a risk to their financial security. In a 2020 Commonwealth Fund survey, more than one-third of adults in commercial insurance plans with a deductible of $1,000 or more said they had not gotten needed health care because of the cost.10 And more than 40 percent of adults with a deductible of that size reported problems paying medical bills or having to pay off medical debt.

In fact, medical bill problems and debt have become endemic in our health system. The media is awash in stories of patients receiving outlandish uncovered bills.11 A recent JAMA article found that 17.8 percent of people in the U.S. had medical debt that was turned over to a collection agency, with the highest debt burdens carried by people living in southern states and in poor zip codes.12 Between 2009 and 2020, the amount of medical debt in collections overtook that of nonmedical debt.

Medical debt has spillover financial implications as well. Among people with employer coverage who had problems paying medical bills or were paying off medical debt, 40 percent said that they had received a lower credit score because of their medical bills, 40 percent had taken on credit card debt to pay their bills, and 35 percent had used up most or all their savings to pay their bills.13

What Can Be Done?

The ACA’s marketplace plan subsidies and expansion in Medicaid eligibility have provided a critical safety net for people in high-priced or bare-bones employer health plans. The Build Back Better Act under consideration in Congress would make the most sweeping enhancements to the ACA since its passage in 2010. These include a substantial increase in marketplace premium subsidies and a new zero-premium marketplace coverage option for Medicaideligible adults who do not have access to Medicaid in their state. In addition, the bill would help more people in unaffordable employer plans gain access to marketplace subsidies. Additional efforts to expand and improve the adequacy of health insurance for U.S. workers might include:

  • Addressing the high health care prices that are driving up employer premiums and deductibles, for example, by adding a public plan option to the marketplaces.14
  • Allowing people to autoenroll in comprehensive health coverage. Creating a public insurance plan as a default option would be essential to a national autoenrollment program.15
  • Informing workers with employer coverage about their options to enroll in subsidized marketplace plans or in Medicaid and informing workers who lose their employer coverage that they are eligible for a marketplace special enrollment period.
  • Fixing the “family coverage glitch.” Under the ACA, families are ineligible for marketplace premiums if a family member’s employer offers single coverage that is deemed affordable (premiums are less than 9.83% of family income; the Build Back Better Act would lower this to 8.5 percent).16 But 5 million people eligible for family employer plans with premium contributions above that threshold are ineligible for marketplace subsidies.17 An administrative fix could save families that switched to marketplace plans an average of $400 a person annually.
  • Reining in deductibles and out-of-pocket costs in marketplace plans by enhancing cost-sharing reduction subsidies and changing the benchmark plan in the ACA marketplaces from silver to gold. One proposal could eliminate deductibles for some people and reduce it for others by as much as $1,650 a year.18
  • Imposing stronger consumer protection rules for medical debt collection, such as grace periods following illness or during appeals processes, and placing bans or limits on medical debt interest rates.19

The cost burden of commercial insurance in the United States is an enduring problem that is undermining Americans’ economic well-being. With the Build Back Better Act, Congress is demonstrating how it can build on the Affordable Care Act to cover the remaining uninsured and make health care affordable to all. But Congress can do more to reduce deductibles and out-of-pocket costs when people get health care. At the same time, policymakers, insurers, employers, health care providers, and drug manufacturers will need to work together to address the high health care prices that are behind much of the growing cost burden weighing on so many working families.

HOW WE CONDUCTED THIS STUDY

This data brief analyzes state-by-state trends in private sector employer health insurance premiums and deductibles for the under-65 population from 2010 to 2020.

The data on total insurance costs, employee premium contributions, and deductibles come from the federal Agency for Healthcare Research and Quality’s annual survey of employers, conducted for the insurance component of the Medical Expenditure Panel Survey (MEPS–IC). The MEPS–IC is administered to workplace establishments. Establishments represent a work location, not necessarily a firm, which can employ people in many locations. Workplace establishments are selected each year from the U.S. Census Bureau’s Business Register — a confidential list of such establishments in the United States. Once selected, establishments are contacted via mail and phone to establish a contact person who is knowledgeable about the health insurance benefits offered to employees. This contact (generally a workplace administrator) is asked about each of the health plans offered to employees that work at the establishment location. If the establishment offers more than four plans, details are collected about the four plans with the largest enrollment. In 2020, MEPS– IC surveyed 40,605 establishments and had a response rate of 56.1 percent. The total number of surveys sent in 2020 was similar to prior years, but there was a lower response rate.

Total premium and other insurances costs are compared with median household incomes for the under-65 population in each state. Income data come from the U.S. Census Bureau’s Current Population Survey (CPS) of households. In the CPS, a “household” includes all persons residing at a single address, regardless of their relationship; a “family” includes all related members of a household. Neither of these definitions reflect a “family unit” for purposes of determining health insurance eligibility. The measure of household income reported here is adjusted to account for the likelihood that individuals residing in the same household are likely to purchase health insurance together — referred to as a health insurance unit (HIU). HIUs are defined based on household and family members’ relationships with the intention of grouping health insurance subscribers and their dependents. For example, a HIU would include the head of household insurance subscriber, spouse, dependent children residing in the same address, and dependent children who are full-time students but not residing at the same address. It would exclude nondependent family members (e.g., an elderly grandparent) who reside at the same address, but who would be included in the Census Bureau’s family or household definition.

Note that the CPS revised its income questions in 2013, affecting the denominator in our ratio estimates. Prior to 2014, this is derived from the traditional CPS income questions, while ratio estimates from 2014 and later are derived from the revised income questions. In 2019, the Census Bureau also updated the way it processes CPS response data; the biggest changes are in the ways missing response data are imputed.20 The Census Bureau’s new imputation strategies resulted in a less than 1 percent change in the median income estimates. Two years of CPS data are combined to generate reliable state-level income estimates. For example, the 2020 income estimates reported here (Table 7) reflect incomes in 2019 and 2020, as reported in the 2020 and 2021 CPS Annual Social and Economic Supplement (ASEC) data files. The Census Bureau found that income data for 2019 (collected in March 2020) and 2020 (collected in March 2021) potentially overestimate household income as the result of a nonresponse bias, introduced by COVID-19-related travel and social distancing restrictions. We have adjusted 2019 and 2020 incomes downward to account for this bias.21

The premiums in this brief represent the average total annual cost of private group health insurance premiums for employer-sponsored coverage, including both the employer and employee shares. We also examine trends in the share of premiums that employees pay and average deductibles. We compared average out-of-pocket costs for premiums and average deductibles to median income in states to illustrate the potential cost burden of each and the total if the worker/family incurred these average costs. The Agency for Healthcare Research and Quality reports MEPS–IC premium, employee contribution, and deductible data separately for single (i.e., employee only) and family plans — we include these data in Tables 3 through 6. However, average employee out-of-pocket costs (Tables 1 and 2) are combined estimates, weighted for the distribution of single-person and family households in the state. For example, the average total employee premium contribution reported in Table 2 is equal to (MEPS–IC single plan contribution for state i * share of single-person households in state i) + (MEPS–IC family plan contribution for state i * share of multiple-person households in state i). The same approach is used to calculate average total deductibles. Average combined employee premium contribution and deductible — also referred to as total potential out-of-pocket spending — is the sum of the household distribution weighted premium contribution and deductible estimates.

The tables provide state-specific data. This analysis updates previous Commonwealth Fund analyses of state health insurance premium and deductible trends.

NOTES
  1. Sara R. Collins, “The Current Status of Employer Health Insurance Coverage in the United States,” invited testimony, U.S. Senate Committee on Finance, Hearing on “Health Insurance Coverage in America: Current and Future Role of Federal Programs,” Oct. 20, 2021.
  2. Sara R. Collins, Gabriella N. Aboulafia, and Munira Z. Gunja, As the Pandemic Eases, What Is the State of Health Care Coverage and Affordability in the U.S.? Findings from the Commonwealth Fund Health Care Coverage and COVID-19 Survey, March–June 2021 (Commonwealth Fund, July 2021).
  3. The MEPS–IC is the most comprehensive national survey of U.S. businesses on their health insurance plans. It surveyed more than 40,000 private-sector employers in 2020. The sampling unit used in the MEPS-IC is the “business establishment.” The Agency for Healthcare Research and Quality identifies an “establishment” as “a particular workplace or location” and a firm as “a business entity consisting of one or more business establishments under common ownership or control.” This means that multiple establishments that are owned by the same firm but operate in different locations would be treated as independent respondents in this survey.
  4. Gary Claxton et al., Employer Health Benefits 2021 Annual Survey (Henry J. Kaiser Family Foundation, Nov. 2021).
  5. Sara R. Collins, Munira Z. Gunja, and Gabriella N. Aboulafia, U.S. Health Insurance Coverage in 2020: A Looming Crisis in Affordability — Findings from the Commonwealth Fund Biennial Health Insurance Survey, 2020 (Commonwealth Fund, Aug. 2020).
  6. In addition to having a high deductible relative to income, people who are insured all year are considered underinsured if their out-of-pocket costs are high relative to income. See Collins, Gunja, and Aboulafia, U.S. Health Insurance, 2020.
  7. Health Care Cost Institute, 2019 Health Care Cost and Utilization Report (HCCI, Oct. 2021).
  8. Bureau of Labor Statistics, “Consumer Expenditures — 2020,” news release, Sept. 9, 2021.
  9. U.S. Department of the Treasury, The Economics of Child Care Supply in the United States (Treasury, Sept. 2021).
  10. Collins, Gunja, and Aboulafia, U.S. Health Insurance, 2020.
  11. See, for example, Kaiser Health News and National Public Radio’s ongoing “Bill of the Month” series.
  12. Raymond Kluender et al., “Medical Debt in the U.S., 2009–2020,” JAMA 326, no. 3 (July 20, 2021): 250–56.
  13. Commonwealth Fund analysis of the Commonwealth Fund Health Care Coverage and COVID-19 Survey, March–June 2021.
  14. Linda J. Blumberg et al., Comparing Health Insurance Reform Options: From “Building on the ACA” to Single Payer (Commonwealth Fund and Urban Institute, Oct. 2019); John Holahan, Michael Simpson, and Linda J. Blumberg, What Are the Effects of Alternative Public Option Proposals (Urban Institute, Mar. 2021); Robert A. Berenson et al., Addressing Health Care Market Consolidation and High Prices: The Role of the States (Urban Institute, Jan. 2020); and Sherry A. Glied and Jeanne M. Lambrew, “How Democratic Candidates for the Presidency in 2020 Could Choose Among Public Health Insurance Plans,” Health Affairs 37, no. 12 (Dec. 2018): 2084–91.
  15. Linda J. Blumberg, John Holahan, and Jason Levitis, How Auto-Enrollment Can Achieve Near-Universal Coverage: Policy and Implementation Issues (Commonwealth Fund, June 2021).
  16. Timothy S. Jost, “Eliminating the Family Glitch,” To the Point (blog), Commonwealth Fund, May 18, 2021.
  17. Matthew Buettgens and Jessica Banthin, Changing the “Family Glitch” Would Make Health Coverage More Affordable for Many Families (Urban Institute, May 2021).
  18. Improving Health Insurance Affordability Act of 2021, S.499, 117th Cong. (2021), S. Doc. 1–6; and Linda J. Blumberg et al., From Incremental to Comprehensive Health Insurance Reform: How Various Reform Options Compare on Coverage and Costs (Urban Institute, Oct. 2019).
  19. Chi Chi Wu, Jenifer Bosco, and April Kuehnhoff, Model Medical Debt Protection Act (National Consumer Law Center, Sept. 2019).
  20. Trudi Renwick, “CPS ASEC Redesign and Processing Changes,” Census Blogs, U.S. Census Bureau, Sept. 4, 2019.
  21. Jonathan Rothbaum and Charles Hokayem, “How Did the Pandemic Affect Survey Response: Using Administrative Data to Evaluate Nonresponse in the 2021 Current Population Survey Annual Social and Economic Supplement,” Census Blogs, U.S. Census Bureau, Sept. 14, 2021; and Jonathan Rothbaum and Adam Bee, Coronavirus Infects Surveys, Too: Survey Nonresponse Bias and the Coronavirus Pandemic, SEHSD working paper no. 2020-10 (U.S. Census Bureau, May 3, 2021).

Publication Details

Date

Contact

Sara R. Collins, Senior Scholar, Vice President, Health Care Coverage and Access & Tracking Health System Performance, The Commonwealth Fund

[email protected]

Citation

Sara R. Collins, David C. Radley, and Jesse C. Baumgartner, State Trends in Employer Premiums and Deductibles, 2010–2020 (Commonwealth Fund, Jan. 2022). https://doi.org/10.26099/m5dt-5f70