Abstract
- Issue: Given uncertainty about the future of the Affordable Care Act, it is useful to examine the progress in coverage and access made under the law.
- Goal: Compare state trends in access to affordable health care between 2013 and 2016.
- Methods: Analysis of recent data from the U.S. Census Bureau and the Behavioral Risk Factor Surveillance System.
- Findings and Conclusions: Between 2013 and 2016, the uninsured rate for adults ages 19 to 64 declined in all states and the District of Columbia, and fell by at least 5 percentage points in 47 states. Among children, uninsured rates declined by at least 2 percentage points in 33 states. There were reductions of at least 2 percentage points in the share of adults age 18 and older who reported skipping care because of costs in the past year in 36 states and D.C., with greater declines, on average, in Medicaid expansion states. The share of at-risk adults without a recent routine checkup, and of nonelderly individuals who spent a high portion of income on medical care, declined in at least of half of states and D.C. These findings offer evidence that the ACA has improved access to health care for millions of Americans. However, actions at the federal level — including a shortened open enrollment period for marketplace coverage, a failure to extend CHIP funding, and a potential repeal of the individual mandate’s penalties — could jeopardize the gains made to date.
Background
The year 2017 marked a turning point in the implementation of the Affordable Care Act. Republicans in Congress attempted to repeal and replace the Affordable Care Act numerous times, ultimately failing but promising to try again. In addition, the Trump administration significantly cut funding for outreach and enrollment activities during 2018’s open enrollment period for the marketplaces, and disrupted markets by declining to pay insurers money owed to them for providing cost-reduced plans for lower-income enrollees. In December, Senate Republicans passed a tax bill that included a provision to repeal the ACA’s individual mandate penalties, paid by most people who do not have health insurance. Given these developments, many Americans are confused about the ACA’s status, which could reduce the number of people who enroll in health plans for the coming year, despite strong enrollment thus far.
It is useful to assess the changes in coverage and access that happened across states under the law before this tumultuous year. Between 2013, the year before the ACA's major coverage expansions took effect, and the end of 2016, the number of uninsured Americans under age 65 fell by an estimated 17.8 million.1 Uninsured rates declined in every state and the District of Columbia (Exhibit 1).
In this issue brief, we examine the extent to which health care access and affordability improved from 2013 to 2016 for residents in each of the 50 states and D.C. We use six indicators: uninsured rates for working-age adults and for children, three measures of adults’ access to care, and the percentage of individuals under age 65 with high out-of-pocket medical costs relative to their income (Exhibit 2). These measures align with those reported in the Commonwealth Fund’s ongoing series of Health System Performance Scorecards.
Findings
Adult Uninsured Rates Reach Record Lows
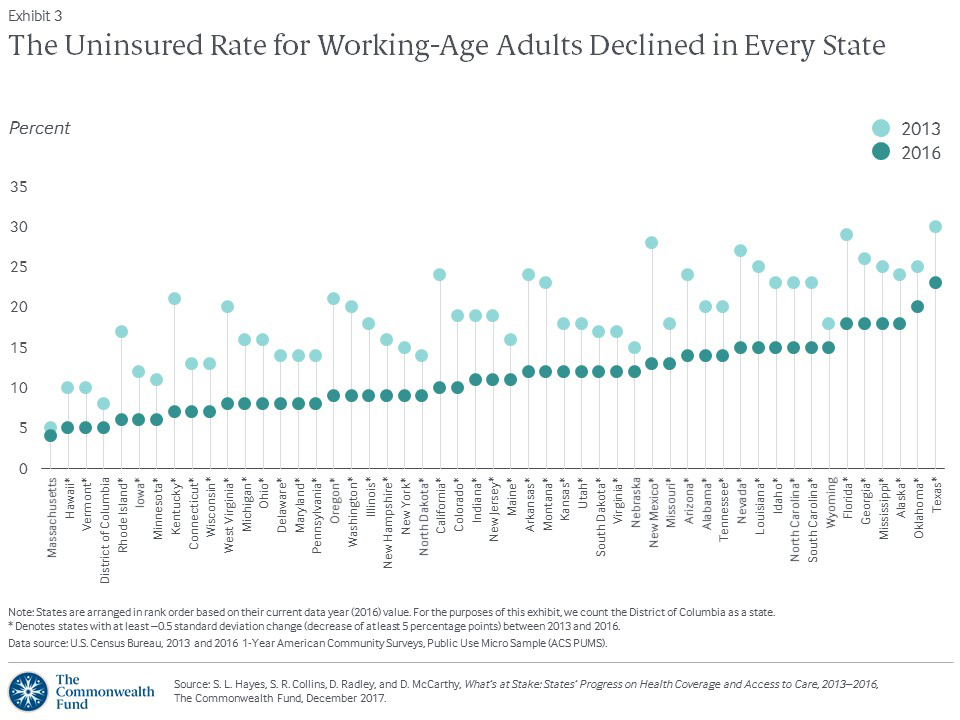
In 2016, in 47 states, the uninsured rate for adults ages 19 to 64 was at least 5 percentage points lower than it had been in 2013, before the ACA coverage expansions. In the remaining three states and the District of Columbia, the rate was lower, but by a lesser margin (Exhibit 3, Appendix Table 1).
Roughly a quarter of states experienced double-digit improvement in their adult uninsured rate, led by New Mexico, where it plummeted from 28 percent to 13 percent over the three-year period. Eleven of the 13 states that experienced at least a 10-percentage-point drop had expanded Medicaid by January 2016. The two exceptions were Florida, which has not expanded Medicaid but enrolled more people in the marketplace than any other state, and Louisiana, which expanded Medicaid in July 2016.
By the end of 2016, in 21 states and District of Columbia, fewer than one of 10 working-age adults lacked health coverage. Three years earlier, that was only true in Massachusetts and D.C. In 2013, at least one of five working-age adults was uninsured in 22 states but by 2016 this was only the case in Oklahoma and Texas.
For the majority of states, the rates fell the most during the first two years of the coverage expansions. In Montana and Louisiana, which implemented the Medicaid expansion the most recently, the rates dropped 4 and 3 percentage points, respectively, between 2015 and 2016.
Uninsured Rates Drop Substantially for Adults with Low Incomes, Especially in Expansion States
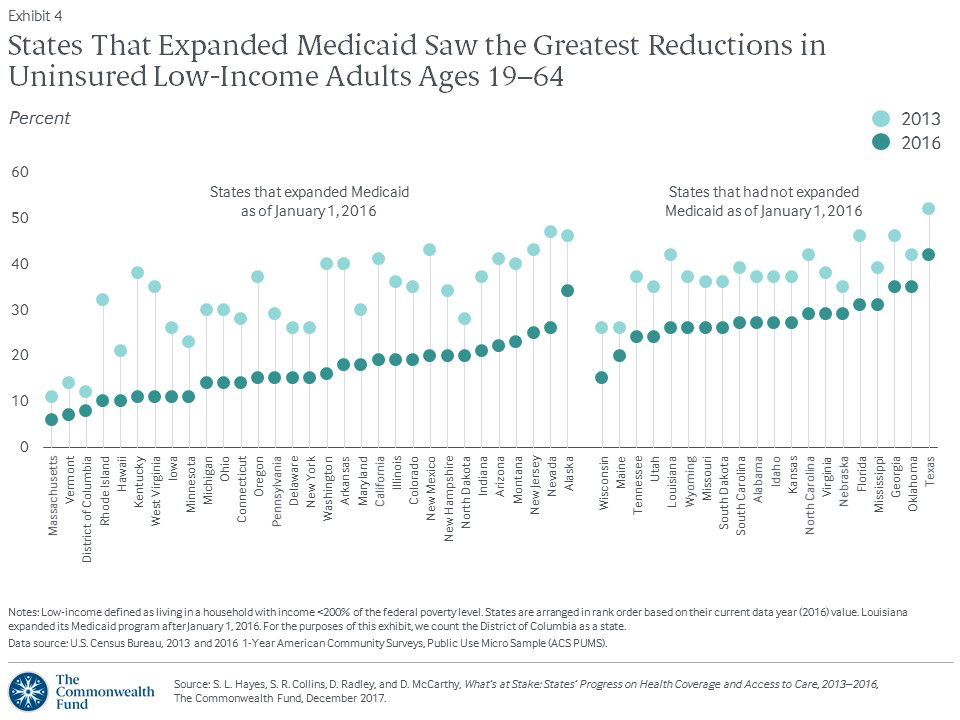
Historically, working-age adults with low incomes have had the greatest risk of being uninsured. The Affordable Care Act’s income-related insurance reforms were targeted to help them. From 2013 to 2016, the national uninsured rate among adults 19 to 64 with incomes below 200 percent of the federal poverty level fell from 38 percent to 23 percent. This meant an estimated 9.9 million more low-income adults had health insurance in 2016 than in 2013.
As expected, the gains were greatest in states that chose to expand Medicaid. Nine expansion states slashed their uninsured rate among adults with low incomes by more than 20 percentage points (Exhibit 4, Appendix Table 2).
By 2016, the uninsured rate among low-income adults was 15 percent or less in a third of states and the District of Columbia. With the exception of Wisconsin, all have expanded Medicaid.2 In contrast, the rate was more than 30 percent in Alaska, Florida, Georgia, Mississippi, Oklahoma, and Texas. Of these, only Alaska has expanded Medicaid. In all six, a lack of awareness of the marketplaces and the availability of subsidized coverage likely contributed to the high rates.3
More Children Get Covered
For years, uninsured rates among children under 19 have been much lower than those for working-age adults, thanks largely to the Children’s Health Insurance Program (CHIP), enacted with bipartisan support in 1997, and to higher Medicaid income eligibility levels for children.
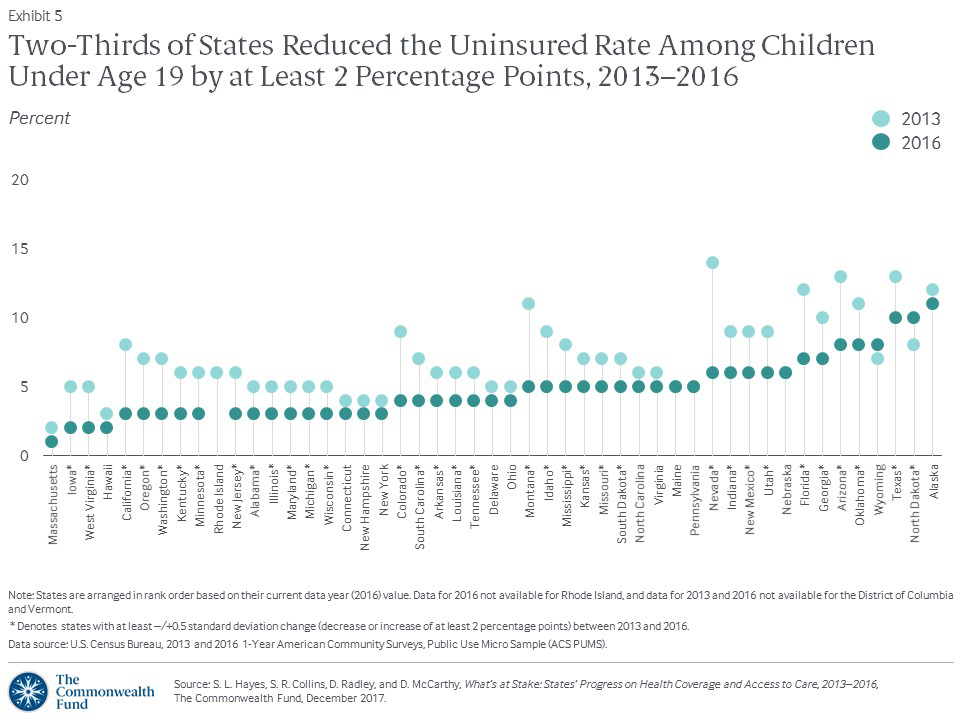
Even so, the nation made more progress toward ensuring all children have health insurance between 2013 and 2016. Nationally, the uninsured rate for children dropped from 8 percent to 5 percent; two-thirds of states saw their rates drop by at least 2 percentage points. The biggest reductions came in Nevada (8 percentage points) and Montana (6 percentage points) (Exhibit 5, Appendix Table 1).
Not all states were as successful. North Dakota children’s uninsured rate was 2 percentage points higher in 2016 than in 2013, and Alaska’s rate increased by 2 points between 2015 and 2016. Both states join Texas in having a children’s uninsured rate of at least 10 percent.
Fewer Adults Face Cost Barriers to Care
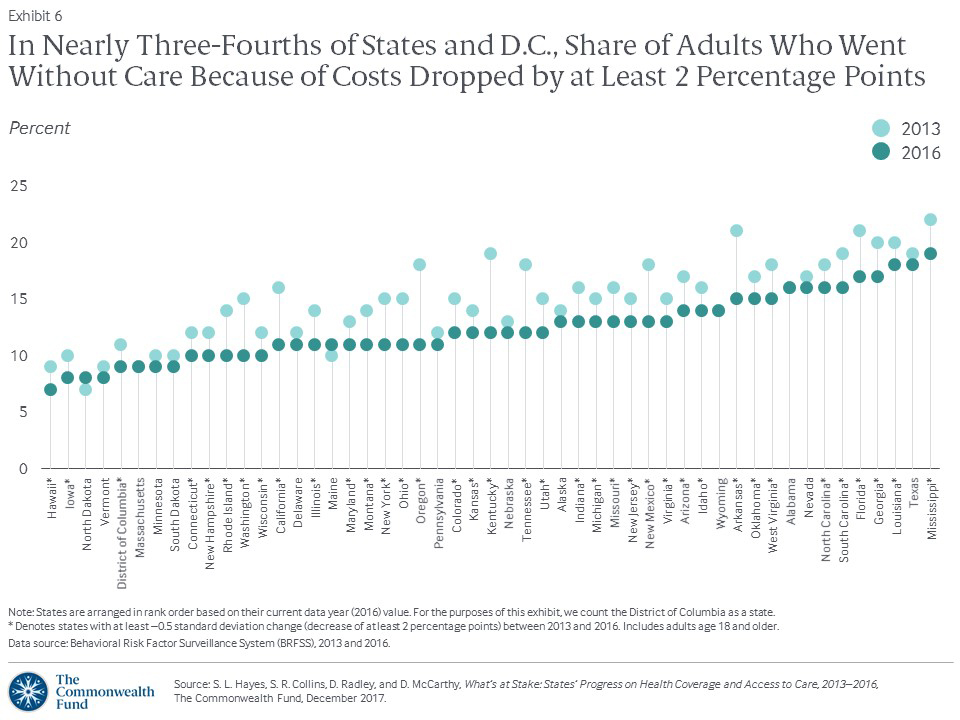
The ACA aimed not only to cover more people, but to improve access to care by reducing financial barriers. Between 2013 and 2016, there was a reduction in the share of adults age 18 and older who reported a time in the last year when they had not gone to the doctor when needed because of cost. This rate fell from 16 percent to 13 percent nationally, and decreased by 2 percentage points or more in nearly three-quarters of states and the District of Columbia (Exhibit 6, Appendix Table 1).
The greatest reductions (5 to 7 percentage points) were in Arkansas, California, Kentucky, New Mexico, Oregon, Tennessee, and Washington. Except for Tennessee, these states all expanded Medicaid as soon as federal resources became available in January 2014 and were among the states with the largest improvement in adult uninsured rates.
Medicaid expansion made a clear difference in reducing cost barriers to care for low-income and minority adults (Exhibit 7, Appendix Table 2). For example, between 2013 and 2016, far fewer low-income adults went without care because of costs in states that expanded Medicaid than did low-income adults in states that did not.
As with uninsured rates, states’ progress on this measure was concentrated in the first two years of the coverage expansions. Most states held the line last year, but in Louisiana, Maine, and Wyoming, the share of adults who went without care because of costs increased by 2 percentage points between 2015 and 2016.
Fewer People Spend a Large Share of Income on Health Care
How does the Scorecard define high out-of-pocket spending on medical care?We used two thresholds to identify individuals under age 65 with high out-of-pocket spending relative to income: those living in households that spent 10 percent or more of annual income on medical expenses (excluding premiums, if insured); and people who spent 5 percent or more, if the household’s annual income was below 200 percent of the federal poverty level. The measure of high out-of-pocket spending reported in this brief includes both insured and uninsured people. This population-based measure is therefore much broader than the underinsurance measure reported in other Commonwealth Fund publications, which is limited to adults ages 19–64 who are insured all year and includes a component of deductible burden.7 |
People who are uninsured often pay the full cost of their medical bills.4 Increasingly, even those with insurance are at risk for high out-of-pocket medical costs because of high-deductible plans and other cost-sharing.5 We examined how many people under age 65 (including both those insured and uninsured) were living in households that spent a high share of their annual income on medical care during 2015–2016 compared to 2013–2014 (Exhibit 8, Appendix Table 1).6 (See box for description of high out-of-pocket spending.)
As uninsured rates declined across the country, so did the share of individuals under age 65 living in households where out-of-pocket spending on medical care was high relative to income. Income growth was also a likely factor in the decline. Between 2013–2014 and 2015–2016, the percentage of people with high out-of-pocket costs declined by 2 points or more in half of states and D.C.
Alaska, Idaho, Nevada, Oregon, and Tennessee saw the greatest improvement, with a 5-to-6-percentage-point reduction. The only two states where the rate of nonelderly residents with high out-of-pocket costs substantially worsened (i.e., increased by 2 to 3 percentage points) were Alabama and Virginia.
Access to Routine Care for At-Risk Adults Improved in More Than Half of States
Who are “at-risk” adults?The at-risk group includes everyone age 50 and older, since people in that age group need recommended preventive screenings and vaccinations, and many have chronic conditions. It also includes the subset of adults ages 18 to 49 who report chronic illnesses or being in poor or fair health. |
We also examined the share of at-risk adults — that is, those who could be at greater risk for poor health outcomes if they do not receive care — who had not visited a doctor for a routine checkup in at least two years. (See box for description of at-risk adults.) Between 2013 and 2016, this rate improved nationally, dropping from 14 percent to 12 percent. More than half of states and D.C. experienced at least a 2-percentage-point improvement.
The greatest improvement (5 points) was seen in Arizona, Arkansas, California, Kentucky, Oklahoma, and Oregon (Appendix Table 1). With the exception of Oklahoma, these states have all expanded Medicaid. In Louisiana and in Tennessee, the rate on this access measure worsened by 2 to 3 percentage points over the three years.
Little Progress in Access to Dental Care
From 2012 to 2016, states showed little progress in improving access to dental care for adults. At the national level, the share of people age 18 and older who went without a dental visit in the past year remained essentially unchanged at 16 percent. The best and the worst state rates, 10 percent and 20 percent, respectively, also stayed the same (Appendix Table 1). In the U.S., dental care is typically covered under a separate policy than medical care; fewer adults have dental coverage than have health insurance.8 Moreover, the ACA did not address dental care for adults. Only six states along with D.C. improved their rates by 2 to 3 percentage points between 2012 and 2016.9 Nine other states saw their rates worsen by an equal margin over the same time period.
How States Stack Up
Looking at the states’ overall rankings across all six indicators of health care access and affordability, the current top-ranked Massachusetts (1st), the District of Columbia (tied for 2nd), Connecticut (4th), and Hawaii and Minnesota (tied for 5th), were all ranked among the top 10 states in access in 2013, before the ACA’s coverage expansions took effect (Exhibit 9). Rhode Island moved up to a tie for second place from 13th in 2013.
Exhibit 9
Summary of Health System Performance Across the Access Dimension

States that had repeated success and those with the most dramatic upward shifts in rankings since the 2013 baseline period all had expanded Medicaid by January 1, 2016. Arkansas, California, Kentucky, Montana, Oregon, and Rhode Island all made double-digit jumps in ranking; Nevada moved up eight places; Washington State and D.C. each rose six places. Wyoming, a nonexpansion state, dropped 19 places, the most of any state, falling from 30th place in the baseline ranking to 49th. On average, states that expanded Medicaid by January 2016 moved up nearly three places between 2013 and the current rankings, while states that did not expand by then dropped about four spots.
Implications
After three years of the ACA’s major coverage expansions, the number of uninsured working-age adults and children in the United States had fallen to a record low. This historic decline was accompanied by widespread reductions in cost-related access problems and improvements in access to routine care for at-risk adults, particularly in states that expanded Medicaid. If the 19 states that have not yet expanded Medicaid decided to expand, they could see similar positive effects for their residents.
There is no deadline for adopting the Medicaid expansion. In November, Maine residents voted to expand Medicaid under a citizen-initiated ballot referendum, indicating that popular support for expanding the program may exist in states where elected officials have rejected it. While implementation in Maine could face hurdles because of opposition from the state’s governor, similar efforts are now under way in other nonexpansion states.
Actions at the federal level could, however, jeopardize the gains made under the ACA. Recent actions by the Trump administration, including a shortened open enrollment period for marketplace coverage and deep cuts in advertising and outreach, could reduce enrollment for 2018.10 In addition, Congress has yet to extend funding for the Children’s Health Insurance Program, which expired at the end of September. In the absence of an extension, more than half of states are projected to run out of federal CHIP dollars by March 2018.11 The result could be a loss of coverage for millions of children.12
Further, the tax bill passed by Senate Republicans included a repeal of the ACA’s individual mandate penalties, which would mean a cancellation of the penalties owed by people who do not take up insurance. The Congressional Budget Office estimated that repealing the penalties would reduce the number of Americans with health insurance by 13 million by 2027 and significantly increase premiums for plans purchased in the individual market. This is because healthy individuals would be the most likely to forgo coverage, leaving sicker people (who are more expensive to insure) in the risk pool.13
People who buy their own coverage on the individual market and who have incomes above 400 percent of the federal poverty level (about $48,200 for an individual and $98,400 for a family of four) — the threshold for ACA premium subsidies — would face the brunt of the premium increase.14 A recent Commonwealth Fund analysis estimates that a 40-year-old buying unsubsidized individual market coverage in one of the 39 states that uses the federally facilitated marketplace would face an average dollar increase in premiums ranging from $556 in North Dakota to $1,264 in Nebraska (Exhibit 10).15
The findings in this issue brief offer further evidence that the Affordable Care Act has put access to health care in reach for millions of Americans, particularly for people in states that embraced the law. We will continue to monitor state trends in coverage and access to see what effect current and future policy changes will have.
