ABSTRACT
- Issue: There have been multiple reports of Americans who cannot afford insulin products.
- Goal: To describe insulin use patterns, out-of-pocket costs, and financial burdens for American adults under age 65 with diabetes over time.
- Methods: Analysis of the Medical Expenditure Panel Survey and National Health Interview Survey.
- Key Findings: Uninsured Americans with diabetes are much more likely to be using less costly (and less effective) formulations of insulin compared to peers with private insurance or Medicaid. Uninsured people are also much more likely to pay full list price for insulin (68%) than the privately insured (9%) or Medicaid beneficiaries (3%). The uninsured spend more out of pocket on all prescriptions ($2,456) than the privately insured ($1,274) and are more likely to report being unable to afford prescription medicines (38% versus 10%). However, among the privately insured, insulin accounts for a significant portion of total out-of-pocket expenses.
- Conclusions: Among those under age 65, increasing access to insurance coverage and the generosity of that coverage are the most important steps for increasing access to insulin. In particular, continued expansion of Medicaid and limiting overall out-of-pocket spending for those with private insurance will protect people with diabetes from high costs.
Introduction
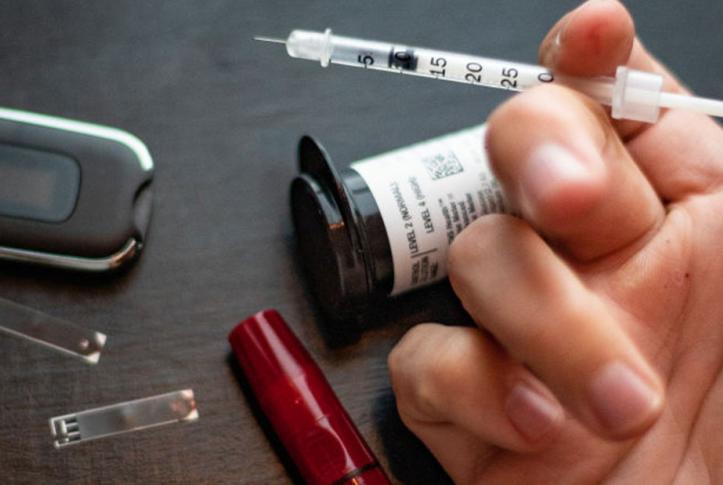
Of the 30 million Americans who have diabetes, about 31 percent take insulin to manage the condition.1 Many varieties of insulin are now available, including rapid-acting and longer-acting agents. Insulin prices also vary considerably: newer, more effective, more easily administered forms of insulin are much costlier than older forms. Recently, list prices of many of the newer forms of insulin have risen rapidly, with average increases of 15 percent to 17 percent per year since 2012.2 For people with diabetes who are insulin-dependent, these high list prices can have tragic consequences. News stories regularly report on people who died or suffered severe complications because they could no longer afford insulin,3 and as many as one in four people with diabetes report rationing insulin to save money.4
Governments have begun to focus attention on this problem. In May 2019, Colorado became the first state to cap insulin copayments at $100 for insured residents.5 In April 2019, Congress held hearings on rising insulin costs,6 and members from both major parties expressed a strong desire to rein in pharmaceutical prices.7
Despite widespread interest in addressing insulin prices, choosing an optimal regulatory solution has been challenging because of the complex nature of insulin pricing (Exhibit 1).
Typically, insulin is sold by manufacturers to pharmaceutical benefit managers (PBMs) at a negotiated list price. Included in this list price are rebates that manufacturers pay to PBMs, which often pass the rebates along to insurers in exchange for a more beneficial placement on insurance plan formularies. The net price that manufacturers collect for the insulin is equal to the list price minus any rebates paid to PBMs, other fees paid to wholesalers, and discounts paid to pharmacies.8 Because many of these rebates, fees, and discounts are negotiated as a percentage of the overall list price, many of these actors have incentives to keep list prices high. As a result, list prices have increased dramatically over the past few years, although the net prices received by manufacturers have been stable or have declined. For example, between 2003 and 2016, the list price for a vial of NovoLog, a popular insulin analog, increased by 310 percent, after adjusting for economywide inflation. However, the net price received by the manufacturer, Novo Nordisk, decreased by 21 percent over the same period.9
The complexity of the insulin supply chain affects different patients differently. For instance, uninsured patients pay list prices, unless they can obtain insulin from compassionate use programs established by manufacturers, philanthropic sources (for example, free clinics), or even insulin-sharing groups on social media. People with Medicaid generally pay nothing out of pocket, or a very modest copayment. Privately insured consumers under age 65 pay varying out-of-pocket prices. Some pay copayments, while others pay an insurer-established price up to a deductible as well as a coinsurance amount up to an out-of-pocket maximum.
This heterogeneous payment structure further complicates policymaking. To the extent that list prices are passed along to insured patients, reducing list prices will reduce these burdens proportionately. For those who pay high coinsurance rates or face high deductibles, limits on the structure of cost-sharing may be more effective. Finally, uninsured patients might benefit most from improving health insurance coverage.
Studies have examined the implications of rising insulin list prices for Medicare Part D beneficiaries, showing substantial increases in out-of-pocket spending per user.10 However, little is known about insulin use in people under age 65. This issue brief uses data from the Medical Expenditure Panel Survey 2014–2017 and the National Health Insurance Survey 2007–2017 to examine the relationships among insurance coverage, out-of-pocket spending, and prescription affordability and access among people ages 18 to 64, not covered by Medicare, who have diabetes. (See “How We Conducted This Study” for more detail.)
Findings
Drug Prices and Drug Use
Exhibit 2 plots the insulin prescriptions in our sample for people with full-year private insurance (both group and individual) and those who were uninsured all year. We plot the proportion of the total cost of each prescription that was paid out of pocket against the total cost of a 1,500-unit equivalent prescription (capped at $750).
We found tremendous heterogeneity in the total price and out-of-pocket cost of insulin in the market of adults under age 65 with diabetes. The total expenditure (from all sources) for a single 1,500-unit prescription of insulin can vary from $0 (typically a free sample) to more than $1,500. For 75 percent of all prescriptions filled, the out-of-pocket share of this total expenditure was less than 15 percent. About 16 percent of all people with diabetes who used insulin paid the full price of any single prescription in any year.
Half of (standardized) insulin prescriptions for privately insured patients are reimbursed at a price between $317 and $425. This is consistent with data on the list prices of common insulin types.11 About 1 percent of 1,500-unit equivalent prescriptions for this group have a total cost of more than $645; these are generally prescriptions for Novolog, Levemir, and Humalog.
Most insulin prescriptions filled by privately insured patients had an out-of-pocket cost between 0 percent and 20 percent of the total cost of their prescriptions. The vast majority of prescriptions filled by privately insured patients (89%) incurred less than $100 in out-of-pocket costs. Only 4 percent of privately insured patients paid the full price of an insulin formulation with a total reimbursed cost of at least $500 at any time over the course of a year (see Appendix Exhibit 2).
Although not shown in Exhibit 2, Medicaid patients used insulin formulations similar to those used by privately insured people.12 Very rarely did they pay more than a minimal amount out of pocket for a prescription.
The situation of uninsured patients is quite different. About half of insulin prescriptions for uninsured patients are reimbursed at a price below $190. Uninsured people are simply not using newer insulin formulations. Their prescriptions are much more likely to be for older, less easily managed forms of insulin.13 For people with type 1 diabetes, some of these formulations are associated with higher risk of hypoglycemic episodes, nocturnal hypoglycemia, and increased within-subject variability of fasting blood glucose.14 Newer insulin analogs are associated with more predictable glycemic control for both type 1 and type 2 diabetes.15
Out-of-pocket spending shares are also dramatically different for uninsured patients. About 47 percent of prescriptions filled by uninsured patients were paid for 100 percent out of pocket, while about 21 percent of prescriptions filled by the uninsured had zero out-of-pocket cost. Overall, about 71 percent of insulin prescriptions filled by uninsured patients cost more than $100 out of pocket.
While privately insured people make up nearly half of all insulin-using people with diabetes ages 18–64, they constituted only 4 percent of those who paid full price for a standardized insulin formulation with a total reimbursed cost of at least $500. Uninsured people and those with a gap in coverage, who represent 17 percent of the insulin-using population with diabetes, constituted 80 percent of those who paid full price for an insulin prescription with a total reimbursed cost greater than $500 at some point during a year (see Appendix Exhibit 2).
In summary, the difference between uninsured and privately insured patients reflects two dynamics. First, uninsured people typically use cheaper, older, and, sometimes less effective, formulations of insulin than do privately insured patients or Medicaid patients. Second, while some uninsured patients are able to get prescriptions through compassionate use or discount programs, many must pay the full cost of their prescriptions out of pocket.
List Prices and Out-of-Pocket Spending for Insulin with a Total Reimbursed Cost of at Least $100
For uninsured patients, however, the pattern is quite different. About two-thirds of uninsured patients who were regular users of insulin with a total reimbursed cost of at least $100 paid full price for a prescription at any time, and those in this group paid full price for a majority of their prescriptions. The median out-of-pocket cost per prescription incurred by uninsured people using these insulin formulations was $16 but total out-of-pocket expenditures for prescription medications were much higher. On average, regular users of insulin formulations with total reimbursed costs of at least $100 who were uninsured spent about twice as much out of pocket on insulin as did those with private insurance ($1,288). In addition, one-quarter of uninsured, regular users of these insulin formulations spent more than $3,619 out of pocket across all their prescription medicines.
Much of the policy attention on insulin costs focuses on people who regularly use new, more expensive insulin formulations with high list prices. Exhibit 3 shows how patterns of payment differ across insurance types among regular users of standardized insulin prescriptions with a total reimbursed cost of at least $100. These prescriptions constitute 85 percent of insulin prescriptions. About 9 percent of regular users of these insulin formulations who held full-year private insurance paid the full price for a prescription at any point during the year, most likely because they had not yet reached their coverage deductible. These costs added up across prescriptions. On average, regular users of insulin formulations with total reimbursed costs of at least $100 who were privately insured all year spent $613 out of pocket on insulin. One-quarter of privately insured, regular users of these insulin formulations spent more than $1,389 out-of-pocket across all their prescription medicines.
Variations Among Those with Private Health Insurance
There are substantial variations in the structure of private health insurance, which may have significant implications for out-of-pocket spending. Under many plans, drugs purchased before reaching a deductible must be paid at list price. Beyond this level, payments depend on plan design. According to the Kaiser Family Foundation Employer survey, 91 percent of covered workers in 2017 were in a plan with tiered cost-sharing for drugs. Depending on the tiering structure and drug tier, 21 percent to 81 percent of 2017 plans required a copayment for prescriptions (copayment-only plans), while 10 percent to 79 percent required coinsurance (coinsurance-only plans).16 High-deductible plans typically incorporate coinsurance above the deductible. As plans have moved to higher deductibles, there has been a trend toward coinsurance designs, which more closely tie out-of-pocket payments to list prices.
While the Medical Expenditure Panel Survey does not provide direct information on insurance design, we were able to use the patterns of out-of-pocket payments in this survey data to classify those with private insurance into copayment-only, coinsurance-only, and unclassified (not classifiable using our algorithm) groups. Consistent with other studies,17 the fraction of privately insured people who used insulin covered by copayment-only plans dropped from 29 percent in 2014 to 24 percent in 2017, while the fraction in coinsurance-only plans rose from 11 percent in 2014 to about 16 percent in 2017.
Exhibit 4 highlights how these variations in plan design affected spending patterns among all insulin users (regular or irregular users) and all types of insulin (costly or inexpensive). We found that people in copayment-only plans typically paid about $10 less out of pocket for each 1,500-unit equivalent prescription than people in coinsurance-only plans. Over the course of a year, this difference added up; the average person in a copayment-only plan spent about $113 less (48% less) on insulin than did the average person in a coinsurance-only plan.
Many people with diabetes also use drugs other than insulin. Those in copayment-only plans spent about 34 percent less on drugs overall than those in coinsurance plans. Finally, drugs comprise about half of total out-of-pocket costs for people with diabetes who used insulin. Across both drugs and other services, mean out-of-pocket costs for those in copayment-only plans were 24 percent lower than those in coinsurance-only plans.
Affordability
The data in Exhibit 4 highlight the potential importance of high deductibles in determining the out-of-pocket exposure of people with diabetes. To see how deductible structure might affect affordability, we used the National Health Interview Survey, which includes questions about prescription drug affordability and separates high-deductible plans from other private insurance.
Exhibit 5 shows how affordability of prescription medication varies by insurance, coverage type, and income. Affordability problems increase as income falls and are much higher among those without insurance coverage. Even among the highest income group, however, people with diabetes enrolled in high-deductible plans report greater affordability problems than those in conventional private insurance plans.
The importance of insurance coverage in promoting access is further documented in Exhibit 6, which describes how affordability has changed over time. Although insulin prices increased rapidly between 2007 and 2017, the Affordable Care Act’s (ACA’s) coverage expansions have reduced the share of those with diabetes in each income group who report difficulty affording prescription drugs. The greatest declines have been among people with incomes between 100 percent and 300 percent of the federal poverty level who have benefited from the ACA’s marketplace-based coverage expansions. In 2017, 45 percent of those with diabetes who reported that they could not afford prescription drugs lived in the South, where many states had not yet expanded Medicaid (data not shown).
Policy Implications
Our analysis suggests that the most important factors affecting the affordability of insulin for people under age 65 with diabetes are the availability of coverage and the form of that coverage. While rising insulin list prices are a serious problem for those who must pay full price for insulin prescriptions, people with adequate coverage — that is, those in low-deductible, copayment-only plans — are often shielded from these price increases.
The single most important policy factor affecting access to affordable insulin for adults ages 18–64 is Medicaid expansion. People with diabetes who can enroll in Medicaid are protected both from high out-of-pocket costs for insulin and from high costs for other dimensions of their care.
For those with private insurance, the structure of that insurance matters a great deal. Enrollees in copayment-only plans are better protected than are those who pay coinsurance for drugs. However, because plans typically include deductibles and out-of-pocket maximums that apply to all care — and because people with diabetes typically need medications other than insulin as well as regular medical services — it is not enough to focus only on the coverage structure for insulin prescriptions. Instead, to ensure adequate financial protection for people with diabetes, policymakers will likely need to address cost-sharing for all types of care.
How We Conducted This Study
We analyzed Medical Expenditure Panel Survey (MEPS) and National Health Interview Survey (NHIS) data from 2014–2017 and 2007–2017, respectively. We then broke these years into three periods: 2014–2017, 2010–2013, and 2007–2009. From the MEPS, we merged the full-year consolidated files, which contained demographic and insurance information, with the prescribed medicines files, which contained information about drug-specific spending. We then took these files and kept all observations of insulin prescriptions to calculate the distribution of insulin out-of-pocket and total costs, both per prescription and overall, for holders of various insurance types in each period. We inflation-adjusted all cost dollar amounts to 2017 dollars, the final year included in our study, and excluded prescriptions to individuals younger than age 18 and older than age 64, or to Medicare patients.
Insulin is sold in varying package sizes and dosages. To facilitate comparisons, we standardized our costs to the cost of a standard 1,500-unit equivalent prescription, using the MEPS variables for drug quantity and strength, and MEPS variables for quantity and strength units. We excluded prescriptions when drug quantity and strength were recorded as unknown.
We report all dollar estimates in 2017 dollars, the final year of our analysis. In some of our analyses, we restricted our sample to regular users of insulin, whom we define as those who filled the equivalent of four or more 1,500-unit equivalent prescriptions for insulin in a year, each with a total reimbursed cost of at least $100 or $500.
To classify private insurance holders into copayment-only, coinsurance-only, and unclassified groups, we looked at out-of-pocket spending on each individual prescription. We defined copayments as any out-of-pocket payment between $5 and $100 that was a multiple of five. Coinsurance payments were defined as any out-of-pocket payments that were not copayments and that accounted for less than 50 percent of the total costs paid out of pocket. We then defined all out-of-pocket payments as payments where the total cost of the prescription was paid completely out of pocket, and we defined zero out-of-pocket payments as prescriptions where the out-of-pocket cost was equal to zero.
For the NHIS files, we merged the sample adult files, person files, and family files from each of the aforementioned periods. The sample adult files contained information about drug affordability and diabetic status, the person files contained insurance information, and the family files contained information about income. After merging these files, we restricted the sample to those who reported being told they had diabetes, and then we examined the relationship between familial income and insurance status in this group.
Acknowledgments
We would like to thank Elbert Huang for his help with deciding how to best standardize insulin prescriptions for comparison.