
Advanced Search

Advanced Search

Current Filters

Filter your query

Publication Types

Other

to

Issue Briefs

/

How Policies to Expand Insurance Coverage Affect Household Health Care Spending

Toplines
  • Enhanced premium tax credits have reduced marketplace coverage costs and increased enrollment, but more reforms are needed to eliminate coverage gaps and lower household health care spending — particularly in states that haven’t expanded Medicaid

  • A targeted health reform package building on enhanced marketplace tax credits could lead to substantial savings for low-income households while covering an additional 3.7 million people

Abstract

  • Issue: The recently passed Inflation Reduction Act extended enhanced tax credits for health insurance premiums first introduced by the American Rescue Plan Act. This legislation could serve as a foundation for additional reforms to further expand coverage and make health care more affordable.
  • Goal: Analyze the financial impact for U.S. households of a proposed health reform package that would: 1) fill the Medicaid coverage gap in states that have not expanded Medicaid eligibility; 2) reduce the employer affordability threshold; 3) add a $10 billion reinsurance fund; 4) increase the federal Medicaid matching rate in expansion states; and 5) reduce cost sharing in marketplace plans.
  • Methods: Using the Urban Institute’s Health Insurance Policy Simulation Model, we assess changes in household spending on health care, in dollars and as a percentage of income.
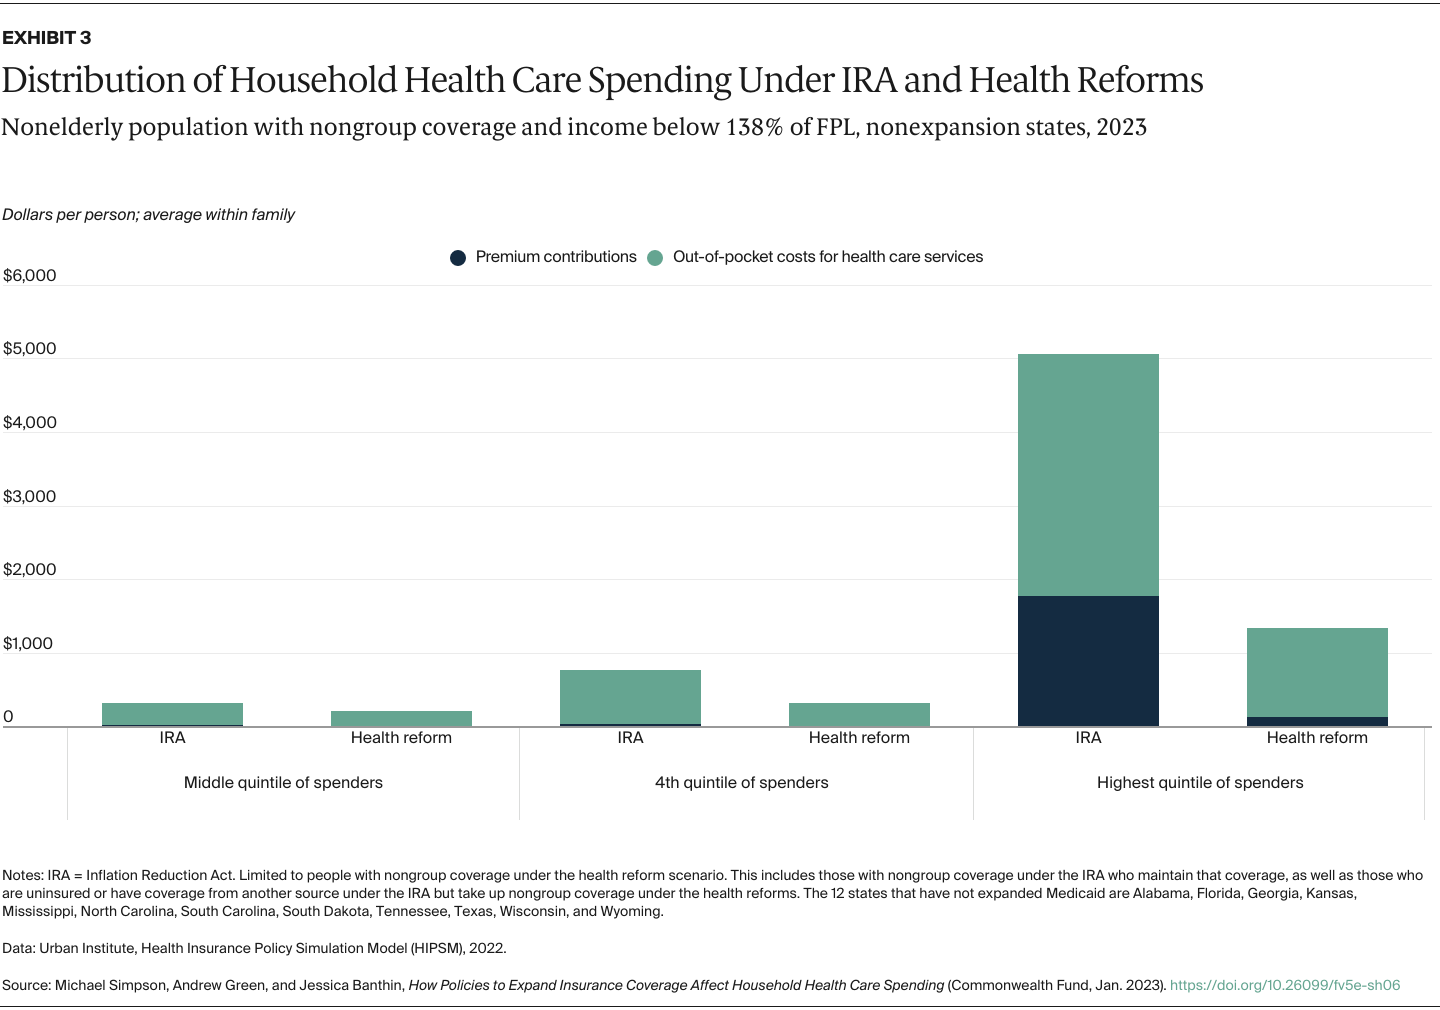
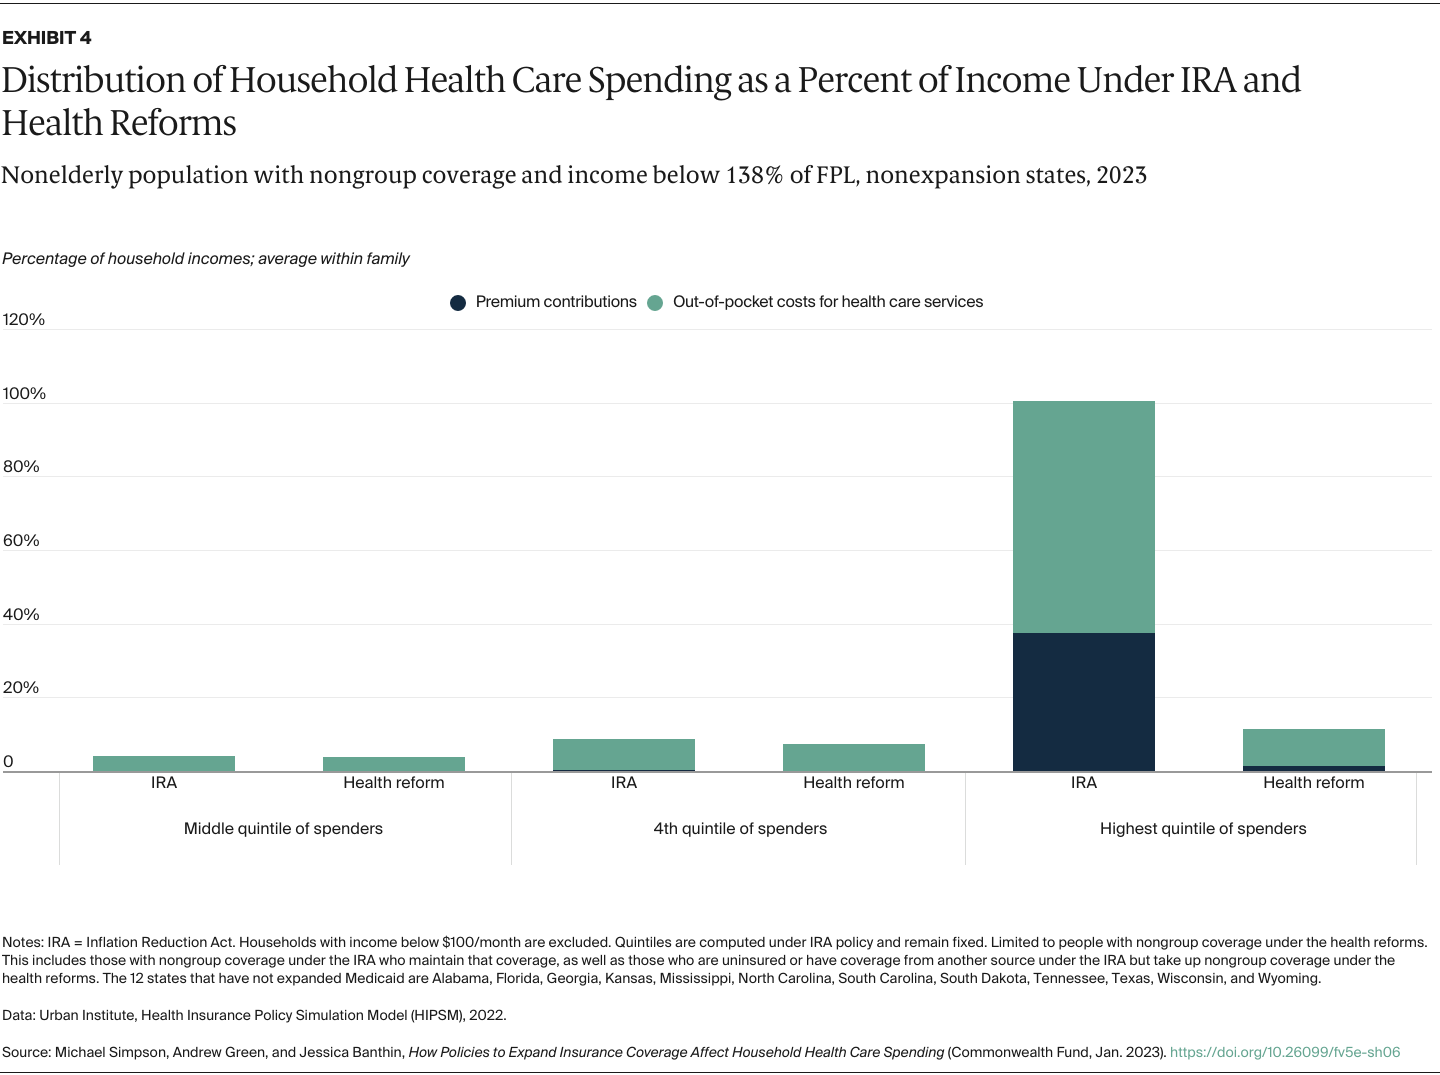
  • Key Findings and Conclusions: The reforms reduce health spending for targeted households. These reductions would be greatest for households spending the most on health care, both in dollars and as a share of income. Filling the Medicaid coverage gap would lead to substantial savings for low-income households in states that haven’t expanded Medicaid. Households also see significant savings from enhanced cost-sharing subsidies.

Introduction

Enhanced premium tax credits — first introduced under the American Rescue Plan Act and extended by the Inflation Reduction Act (IRA) — substantially reduced marketplace coverage costs and led to a significant increase in enrollment.1 However, these tax credits leave out many people also needing better access to affordable coverage, particularly those who live in the 12 states that have not expanded Medicaid eligibility as permitted under the Affordable Care Act (ACA). Additional policies are needed to address these gaps and further lower household spending on copayments, deductibles, and other cost sharing.

The impact of health reforms is usually measured by its effects on aggregate costs and coverage, such as the number of uninsured. The distributional impact on household financial burdens is not captured consistently in standard measures, leaving critical benefits of new health policies unknown.

Using a comprehensive measure of household financial burden, we measured the impact of a reform package that builds on IRA tax credits on the distribution of household spending on health care. The proposed reforms we model would:

  • Make marketplace premium subsidies available to low-income people in the 12 states that have not expanded Medicaid, which would benefit people with incomes above traditional Medicaid eligibility levels and below 100 percent of the federal poverty level (FPL), and eliminate the employer offer firewall — or the threshold above which employer coverage is deemed unaffordable — for people below 138 percent of FPL.
  • Enhance and fund cost-sharing reduction subsidies that reduce copayments, deductibles, and other out-of-pocket payments for people with low incomes.
  • Introduce policies to lower the employer coverage firewall to 8.5 percent of income, fund $10 billion in reinsurance nationwide, and increase the federal match rate for Medicaid in nonexpansion states.2

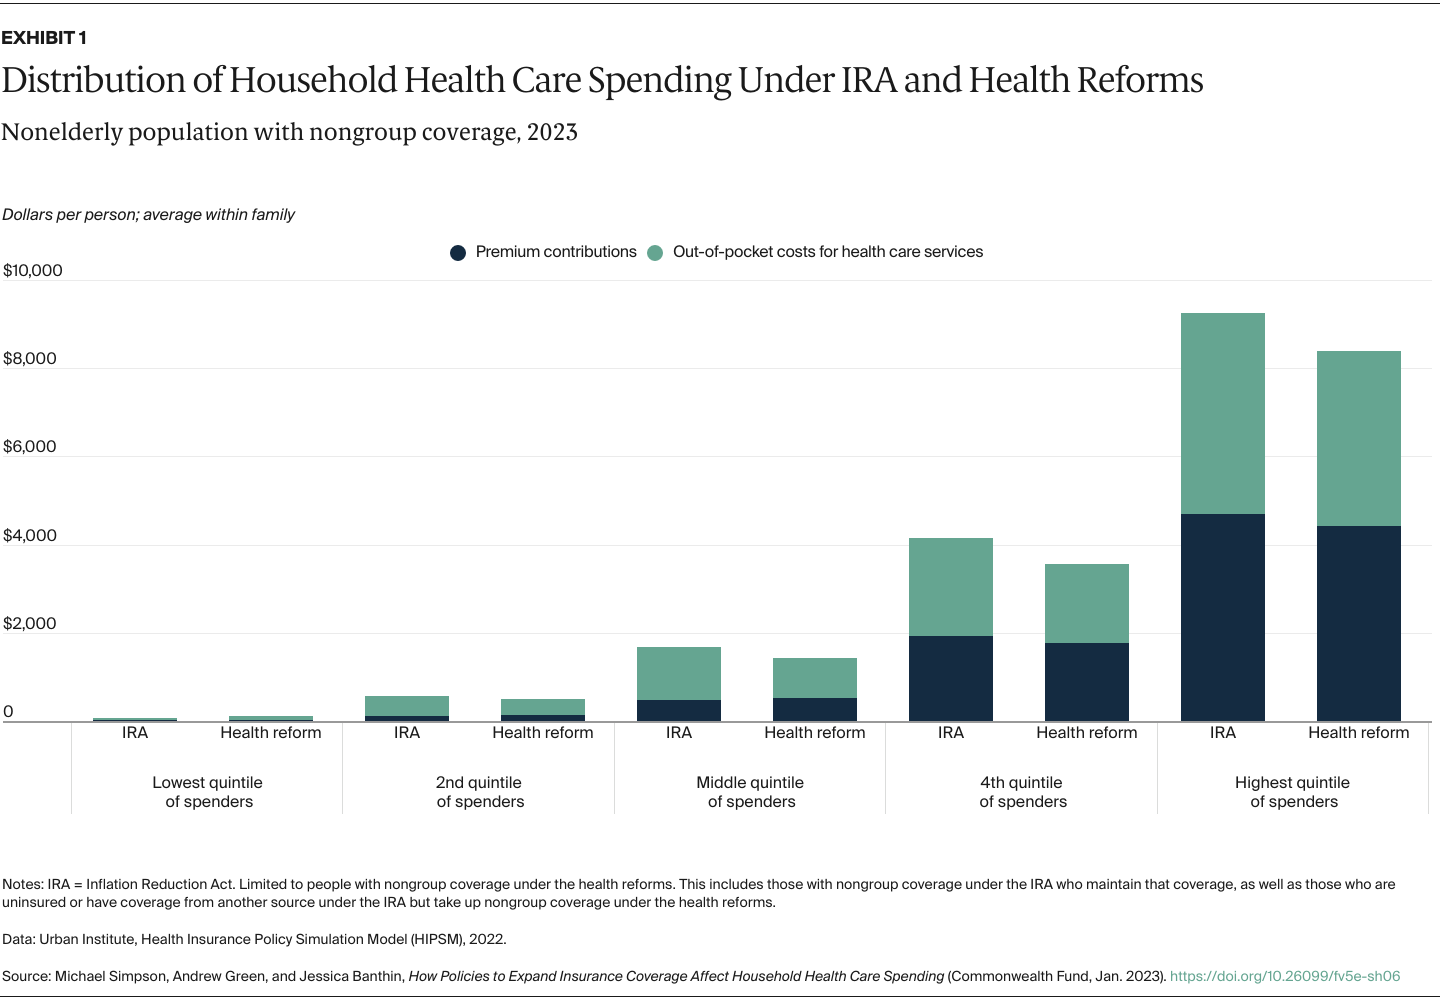
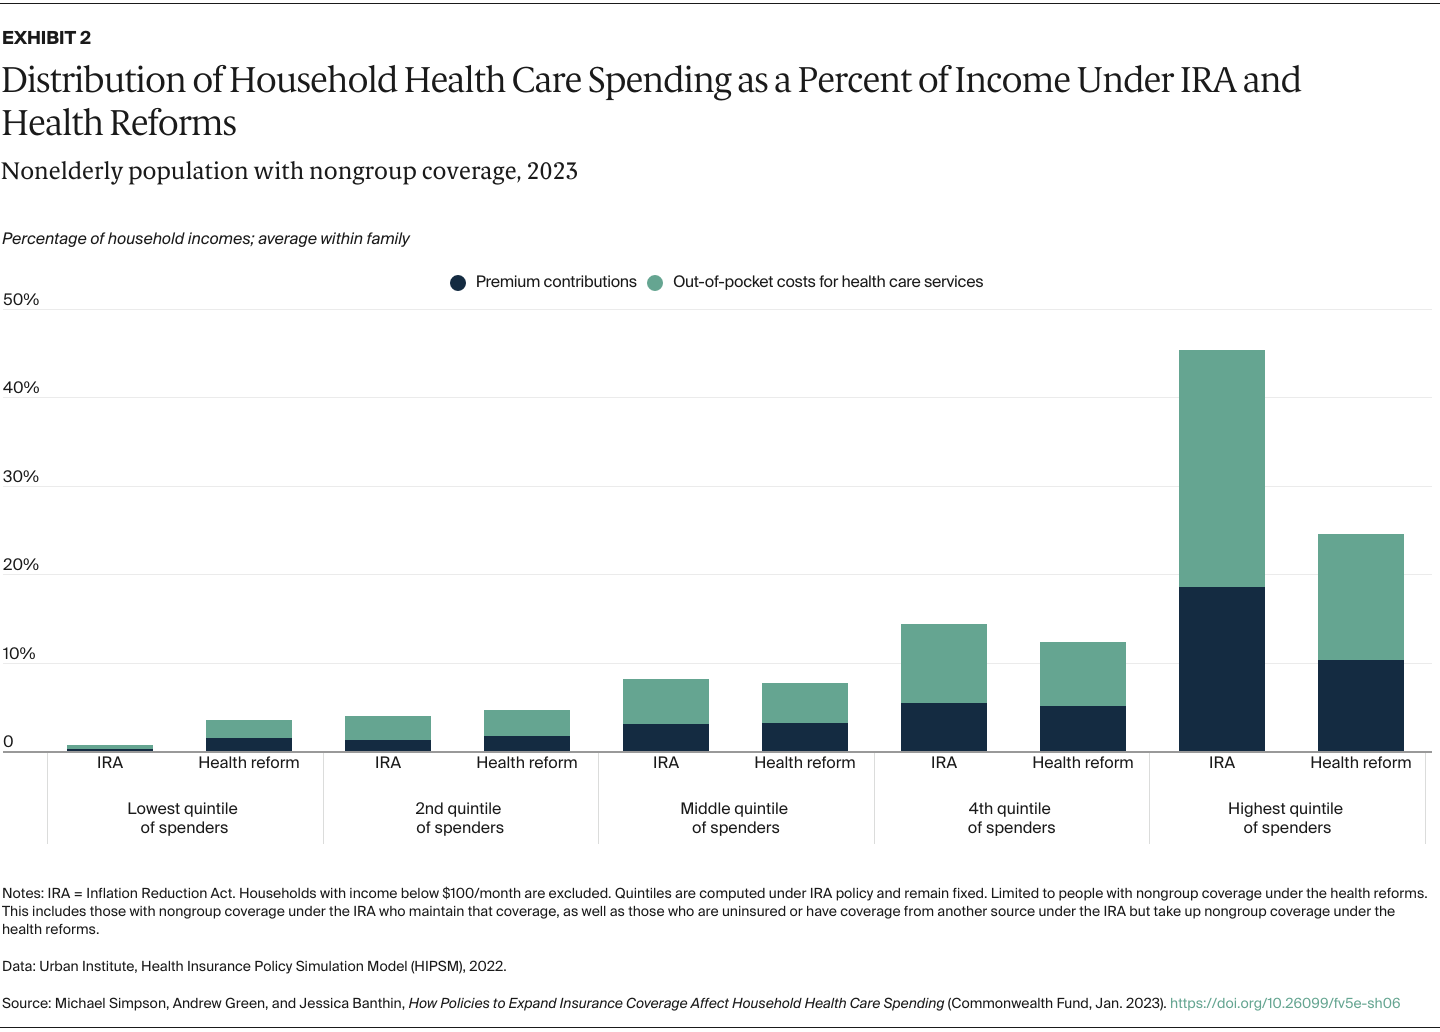
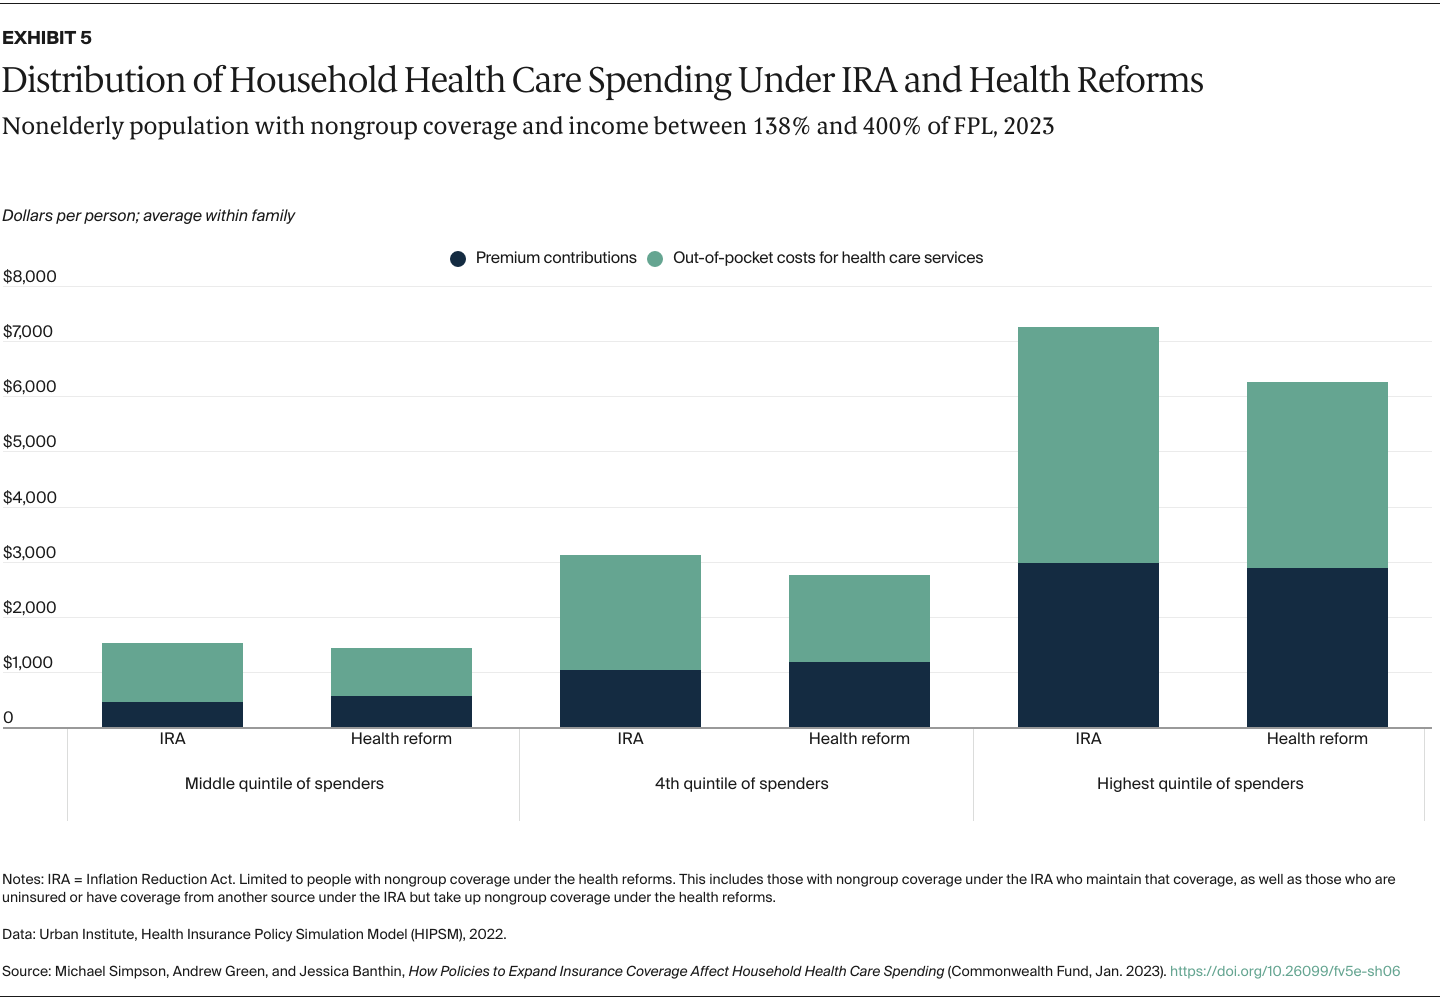
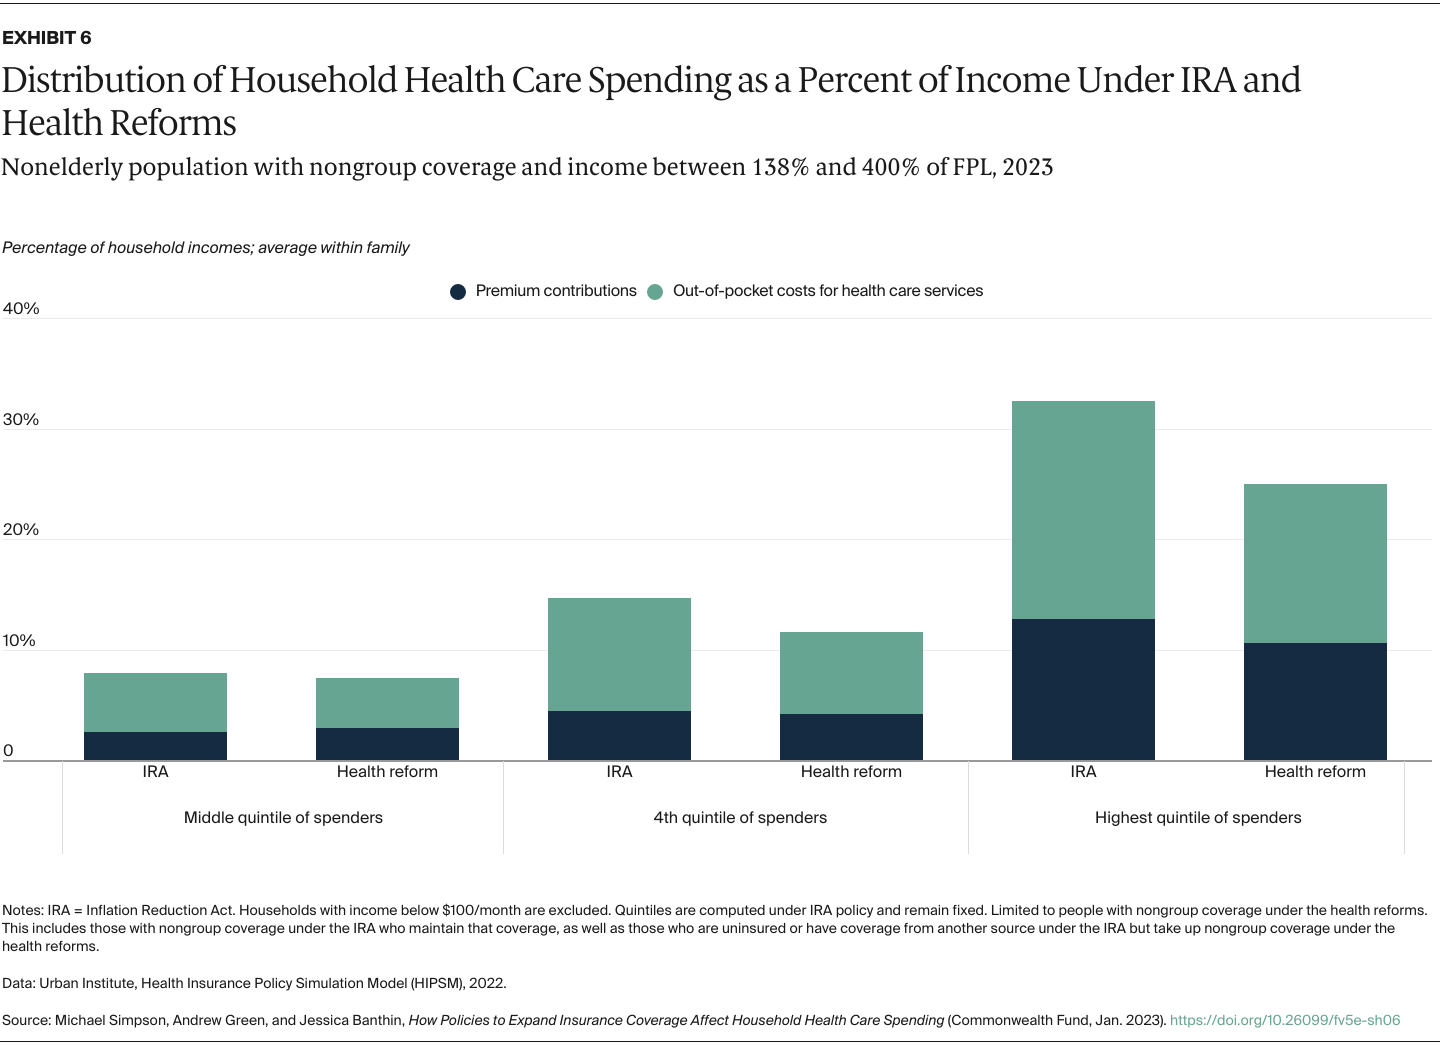
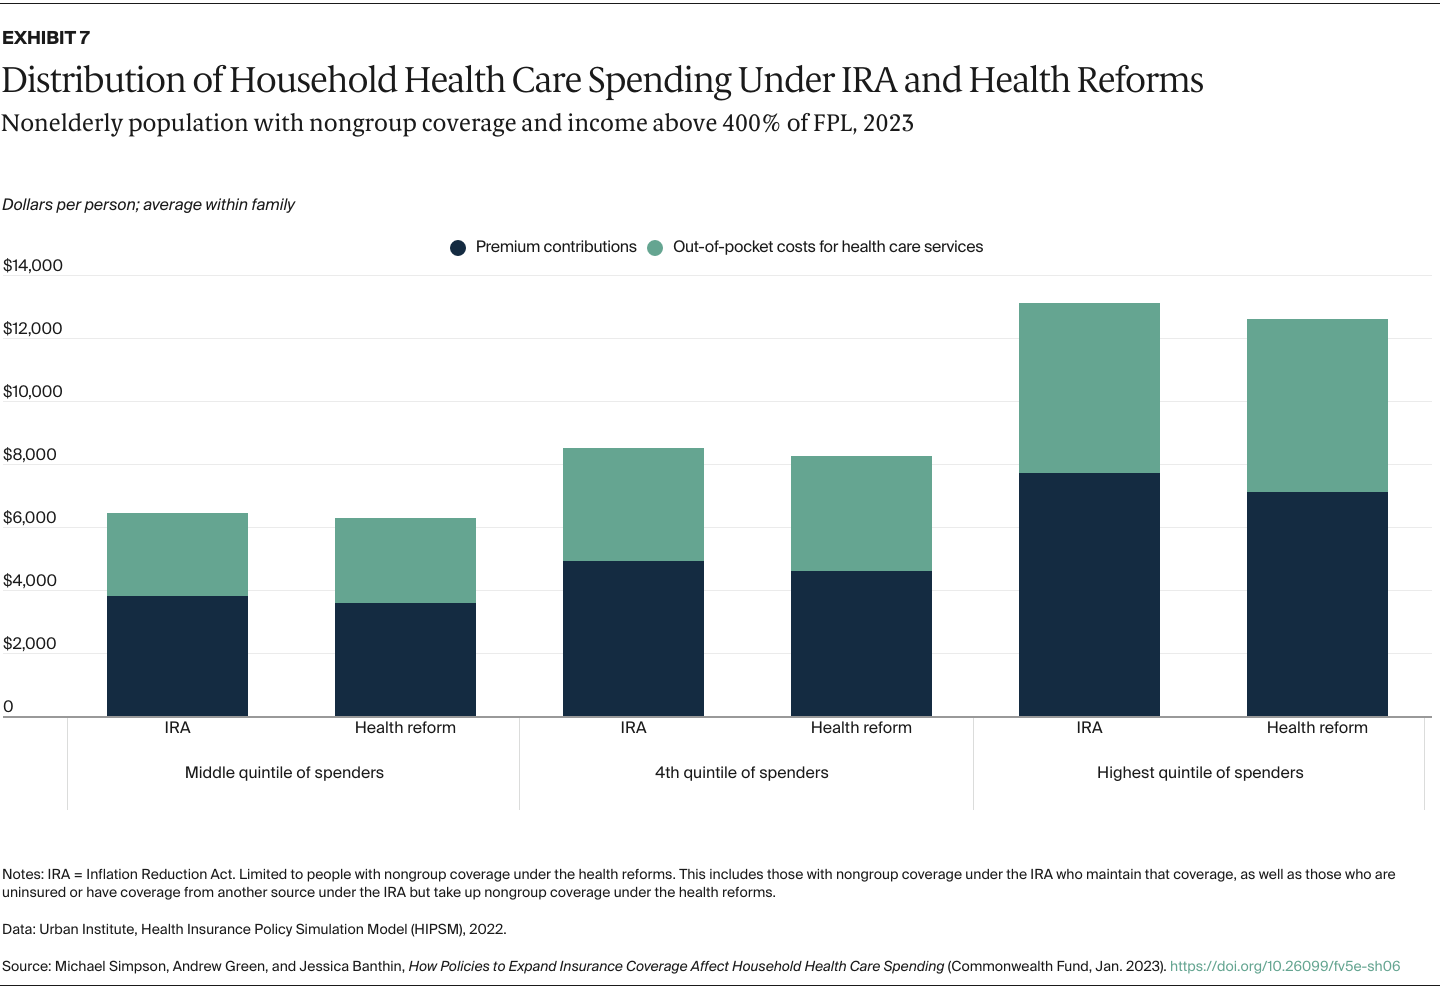
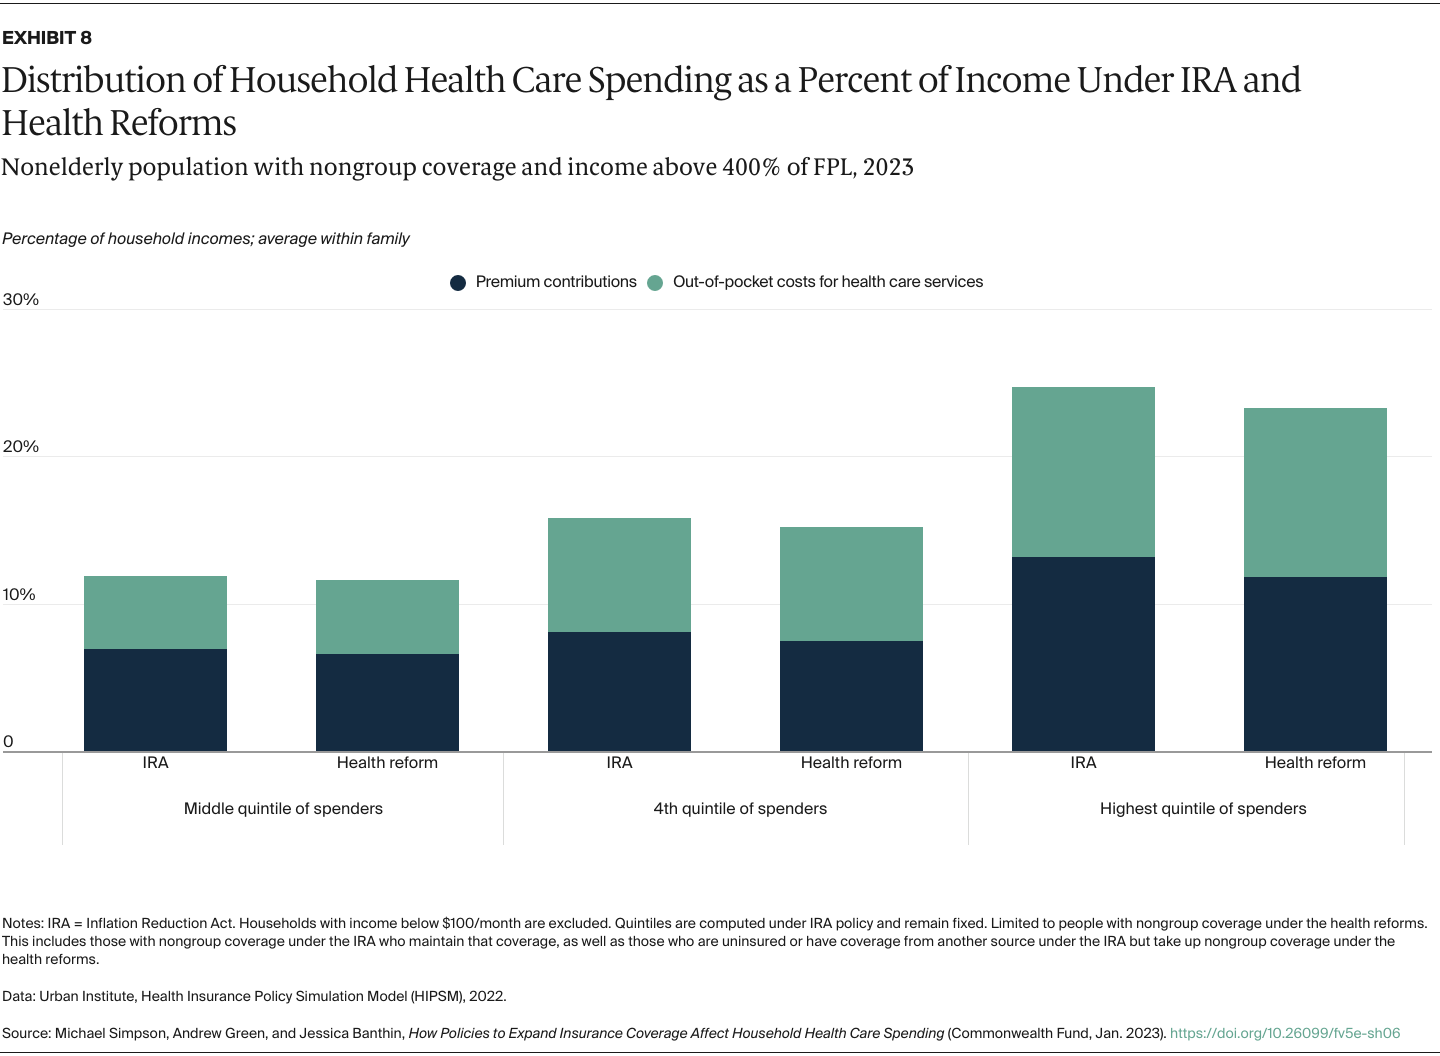
We capture changes in household spending on both premium contributions and expected out-of-pocket spending for health care services because of cost-sharing requirements such as copayments and deductibles. We determine average spending per family member from total household spending so we can look at the distribution of individuals without regard to household size. As health spending is highly skewed — many people spend little while a relative few spend large amounts — we present our results by spending quintiles instead of a simple average to show how reforms would affect those using more health services. Our results are shown both in dollars and as shares of family income to better capture the burden of health care spending on low-income families, who tend to spend a larger share of income on health care costs.

How We Measure the Health Care Cost Burden for Households

In our measure of financial burden, we include both household contributions for premiums and out-of-pocket payments for health services used by all family members — the latter accounting for a large share of health care spending for those with serious or chronic conditions. We determine average spending per family member from total household spending so we can look at the distribution of individuals without regard to household size.

We present our results on financial burden in dollar terms, by quintiles of health care spending, to assess the impact of policies that may differ by levels of health spending, which tend to vary significantly between households (for example, because of family members’ serious health conditions).

Results are also presented as a percentage of family income to highlight the impact of policies on low-income families, which tend to spend a larger share of income on health care costs. Many households with high medical-spending-to-income ratios report having extremely low incomes — sometimes only a few thousand dollars annually or less — possibly because of reporting errors in the underlying survey data. We exclude households with incomes less than $1,200 per year ($100 per month) from the percent-of-income measure.3

Additionally, our measure does not account for the ways households finance large expenditures on health care services or the timing of those payments relative to income — people may borrow funds from relatives or put charges on credit cards to pay off over time.

For more information on our measures of household financial burden, please see Appendix 2.

Findings

The Impact of Reforms on Health Coverage

The health reform package would cover 3.7 million more people in 2023 than would be covered under the IRA’s enhanced premium tax credits alone.4 Nearly 5.1 million more people would have nongroup coverage, most with tax credits. About 1.6 million people would switch out of employer-sponsored coverage. The two components that would produce the greatest impact on overall coverage are filling the Medicaid eligibility gap in the 12 states that haven’t expanded Medicaid and increasing cost-sharing reduction subsidies.

The Impact of Reforms on Household Spending

Exhibit 1 contrasts the distribution of household health care spending under the baseline (IRA subsidies only) and under the health reform package for the under-65 population with nongroup coverage. We focus only on people with nongroup coverage because the effects of reforms are concentrated in this market (Appendix 3 displays this measure for all nonelderly people, regardless of coverage).

Under the baseline, people in the top quintile of spenders can expect to pay more than $9,000 per year on average on premiums and out-of-pocket cost sharing. We estimate that the health reforms would reduce spending for people in all but the lowest quintile of spenders. This spending reduction is largely the result of savings on out-of-pocket costs for health care services, though spending on premiums would decline in some quintiles as well. People in the middle, fourth, and highest quintile save an average of $256, $583, and $872 respectively under the policy.

Simpson_policies_expand_coverage_household_spending_Exhibit_01

In Exhibit 2, we measure spending as a percentage of household income rather than dollars (see Appendix 2 for further discussion of this metric). People in the highest quintile of spending as a percentage of income would see substantial savings in both premiums and out-of-pocket spending under the reforms: those spending 45 percent of income on health care under the baseline would see their costs fall to 25 percent of income under the reforms.5 Filling the Medicaid gap would be particularly effective, though the other policies would bring down spending as well.

People in the middle and fourth quintiles also would see small declines in spending under these reforms, with average spending declines of one-half and two percentage points, respectively. The reforms would lead to modest increases in spending as a share of income for people in the lowest and second quintile of spenders. This simply reflects greater access to health care — as the formerly uninsured gain coverage, their health care use and spending increase.

Simpson_policies_expand_coverage_household_spending_Exhibit_02

The Impact of Reforms at Different Income Levels

To see how the reforms affect people with different incomes, we examine three groups: under 138 percent of FPL in nonexpansion states, 138 percent to 400 percent of FPL, and above 400 percent of FPL. We focus on the changes to spending among those in the middle, fourth, and highest quintiles of spenders because spending and reform effects are small in the first two quintiles.

People with incomes below 138 percent of FPL in nonexpansion states. Exhibit 3 shows the effects of the health reform package for people in this income group in the 12 states that have not expanded Medicaid under the ACA. We focus only on nonexpansion states because the reform with the greatest effect on this group is the closing of the Medicaid gap.

People in the highest quintile of spenders would save substantially. Gaining access to generous coverage without premiums would lead to considerable savings on out-of-pocket spending and savings on premium costs for people with employer-sponsored insurance or unsubsidized nongroup coverage. Average spending for people in the highest quintile would decline by $3,736 under this policy. People in the middle and fourth quintiles would also save an average of $109 and $451, respectively.

Simpson_policies_expand_coverage_household_spending_Exhibit_03

Exhibit 4 expresses the change in spending as a share of household income for the same group. People in the highest quintile of spending to income would see a dramatic decline in spending as a percentage of household income, from 100 percent before the policy reforms down to 11 percent. This large drop is driven by a 36-point decline in premium spending and a 53-point decline in out-of-pocket spending. People in the middle and fourth quintiles would see average total declines of 0.2 and 1 percentage points, respectively, driven mostly by out-of-pocket savings.6

While it may be surprising to see the top quintile of health care spenders in this group report spending amounts equal to 100 percent of annual household income, this is not uncommon in very-low-income households.7 In the previous exhibit, we saw average spending of about $5,000 per year in the top quintile, and in this exhibit, the average annual household income per person is just under $5,500 in the top quintile.

Some of these households may have misreported their income in the underlying survey, perhaps because of the wording of the questions, or failed to reflect their full financial situation. This could include people with irregular income sources (like child support or withdrawals from retirement or savings accounts); people with premium contributions that are paid for by someone outside the family unit; people omitting in-kind income (for example, in the form of meals or accommodations); and older adults with low income but some liquid assets.

Simpson_policies_expand_coverage_household_spending_Exhibit_04

People with incomes between 138 percent and 400 percent of FPL. Enhanced subsidies that reduce cost sharing like copayments and deductibles have the greatest impact on spending for this income group (Exhibit 5). Average spending for people in the highest quintile would decline from $7,262 per person to $6,251 under the reforms.

Enhanced cost-sharing subsidies drive most of these savings by reducing out-of-pocket spending, but lowering the firewall and adding a reinsurance fund also bring down average premium contribution spending modestly. Average spending would decline by $97 and $358 for people in the middle and fourth quintiles, respectively, driven entirely by out-of-pocket savings from the enhanced cost-sharing subsidies.

Simpson_policies_expand_coverage_household_spending_Exhibit_05

Exhibit 6 shows the impact of reforms on spending as a percentage of income for the same group. People in the highest quintile would see average spending fall from 33 percent to 25 percent of household income. People in the middle and fourth quintiles would see average spending decline by 1 and 3 percentage points, respectively. As with Exhibit 5, savings are largely driven by lower out-of-pocket spending from the enhanced cost-sharing subsidies, though lowering the firewall and adding a reinsurance fund also bring down premium spending modestly for those in the highest quintile.

Simpson_policies_expand_coverage_household_spending_Exhibit_06

People with incomes above 400 percent of FPL. Exhibit 7 shows average spending for those in the middle, fourth, and fifth quintiles of this income group declines by $141, $251, and $516, respectively, under the health reforms. These savings are driven entirely by lower spending on premiums under the final two reforms: adding a reinsurance fund and providing enhanced cost-sharing subsidies. By covering some costs for those with the highest expenditures, the reinsurance fund reduces insurers’ risk, allowing them to lower total premiums. Additionally, the enhanced subsidies would be directly federally funded under the reform package — instead of through indirect federal funding under the baseline — which would eliminate silver loading and reduce marketplace premiums.8

The reforms have a relatively limited effect on premium spending in other income groups, because these groups are largely insulated from the direct costs of premiums by the premium tax credit percentage-of-income limits. Many people in this income group have incomes too high to be eligible for tax credits, so these individuals would save money as premiums fall.

Simpson_policies_expand_coverage_household_spending_Exhibit_07

Exhibit 8 shows the results as a percentage of income for the same group. People in the middle, fourth, and highest quintiles would see average spending declines of 0.2, 0.7, and 1.5 percentage points, respectively, under the health reforms. As with Exhibit 7, savings are largely driven by lower premium spending from providing (and funding) enhanced cost-sharing subsidies and adding a reinsurance fund.

Simpson_policies_expand_coverage_household_spending_Exhibit_08

Discussion

Household financial burdens, an important dimension of health care reforms, are often overlooked in favor of aggregate coverage and cost effects. When financial burdens are examined, models often focus on the average impact across a given population. But given that many policies have large impacts on certain subpopulations and very little impact on others, it’s useful to measure the distributional effects of reforms.

Our analysis shows that the health reform package evaluated here would have the largest impact on the lowest income groups. People with nongroup coverage and incomes below 138 percent of FPL would see larger savings, in both dollar terms and as a share of income, than people in higher income groups.

Further, these policies are well targeted at reducing spending for Americans currently facing the highest spending burdens. In all the populations we evaluated, those in the highest quintile of spenders would see the largest reductions in spending; these savings would be particularly dramatic for the highest quintile of spenders in the lowest income group.

Overall spending changes, however, aren’t huge, since these policies primarily affect the nongroup insurance market. Many more people have employer-sponsored coverage or Medicaid than nongroup coverage, so reforms to the nongroup market will not result in major changes for the whole population.

Closing the Medicaid gap would have substantial effects, expanding coverage and significantly improving affordability. Other reforms would have more limited effects, but these can be significant for the affected groups. For example, providing and funding enhanced cost-sharing subsidies would reduce out-of-pocket expenses considerably for those directly targeted by the policy — people with incomes between 200 percent and 400 percent of FPL. People with incomes above 400 percent of FPL also would save on premiums, which fall because they are no longer silver loaded.

HOW WE CONDUCTED THIS STUDY

Our estimates use the Urban Institute’s Health Policy Insurance Policy Simulation Model’s (HIPSM) baseline for 2023. HIPSM is a detailed microsimulation model of the health care system designed to estimate the cost and coverage effects of proposed health policy options. HIPSM is based on two years of the American Community Survey, which provides a representative sample large enough to produce estimates for individual states or smaller regions such as cities. Because HIPSM is a microsimulation, results are available at an individual level. This allows us to look at spending within families and to break down results by income levels and coverage types; those breakdowns illuminate the differential effect of policies on groups. Effects can be shown for any group with sufficient sample size.

We updated the model using state-level marketplace enrollment from the 2022 open enrollment period snapshot released by the Centers for Medicare and Medicaid Services and estimated the increase in marketplace coverage resulting from losses of Medicaid enrollment after the COVID-19 public health emergency expires using our recently updated estimates of Medicaid enrollment in 2022 and 2023. Details of our methodology are described in a separate report.9

These reforms do not include the effects of the recent rule change to fix the “family glitch.” The glitch occurs because, as currently applied, an offer of insurance from an employer disqualifies their entire family from ACA marketplace subsidy eligibility if the premium for that individual worker is deemed affordable, even if the premium for the family would be deemed unaffordable. If the revised rule were included, the marginal effects on coverage and costs of each reform would remain nearly the same as shown, because the results of the fix — about 200,000 fewer people would be uninsured and around 700,000 people would have new marketplace coverage with premium tax credits, most of whom would have shifted from employer coverage — would be in both the baseline and each of the reforms shown here.10

Our analysis is simulated for 2023 and assumes that reforms are fully phased in by that year. By 2023, economic conditions are expected to be stable following the COVID-19 pandemic and the 2020 recession. We assume, consistent with Congressional Budget Office projections, that the economy will have largely recovered from the pandemic and recession by that time. In the process of preparing this paper, the economy has grown rapidly and unemployment remains low, but the rate of inflation has increased considerably, the Federal Reserve has begun a series of interest rate increases, and the war between Russia and Ukraine is ongoing. Each of these could affect the underlying assumption of economic stability.

NOTES
  1. Estimates of the effect of the IRA’s enhanced premium tax credits can be found in Matthew Buettgens, Jessica S. Banthin, and Andrew Green, What if the American Rescue Plan Act Premium Tax Credits Expire? (Urban Institute, Apr. 2022).
  2. New federal funding for reinsurance would be $8.7 billion, which, added to $1.3 billion in projected federal spending under existing Section 1332 state innovation waivers, equals $10 billion in federal reinsurance (we assume states that are currently spending towards reinsurance would continue to do so). The increase in the federal Medicaid match rate for expansion adults has no direct effect on household spending. If this reform was paired with tax increases to finance it, the net effect on household spending would depend on the tax reform chosen; see John Holahan, Michael Simpson, and Gordon B. Mermin, Distributional Effects of Alternative Health Reform Proposals (Urban Institute, May 2021). For additional information on the health reform package see John Holahan and Michael Simpson, Next Steps in Expanding Coverage and Affordability After the Inflation Reduction Act (Urban Institute, Sept. 2022).
  3. The $100 per month cutoff is arbitrary but is meant to represent very low income. Inclusion of incomes below this level can result in very high spending to income ratios even when spending is limited.
  4. Holahan and Simpson, Next Steps in Expanding, 2022.
  5. Premiums can exceed 8.5 percent of income under reform because results are limited to people with nongroup coverage but include 4.7 million people with unsubsidized nongroup coverage whose premiums are not limited by the ACA/IRA. Premiums can exceed percent-of-income limits under the IRA baseline for that reason, and, in addition, because people paying premiums for employer-sponsored insurance under the baseline who switch to nongroup coverage under health reform are included in the measure.
  6. People in these quintiles and income groups generally are not paying premiums, and thus cannot save on premiums with the reforms.
  7. Research has shown that overall expenditures by low-income people often significantly exceed reported income. Jessica S. Banthin and Didem M. Bernard, “Changes in Financial Burdens for Health Care: National Estimates for the Population Younger Than 65 Years, 1996 to 2003,” Journal of the American Medical Association 296, no. 22 (Dec. 13, 2006): 2712–19.
  8. Cost-sharing reductions are currently “silver loaded,” meaning insurers increase the premium for the benchmark silver plan to cover spending for the cost-sharing benefits they are required to pay but for which they are not currently directly reimbursed by the federal government. If cost-sharing reductions were federally funded instead, premiums would fall. Because premium tax credits are based on the silver premium and most people with subsidized marketplace coverage are protected from paying more than a fixed share of their incomes for the premium, most of the increase in spending for cost-sharing reductions would be offset by lower spending on premium tax credits by the government. However, for people with higher incomes or those ineligible for subsidies, the lower premiums would result in lower household spending.
  9. Matthew Buettgens and Jessica S. Banthin, Estimating Health Coverage in 2023: An Update to the Health Insurance Policy Simulation Model Methodology (Urban Institute, May 2022).
  10. Matthew Buettgens and Jessica S. Banthin, Changing the “Family Glitch” Would Make Health Coverage More Affordable for Many Families (Urban Institute, May 2021).

Publication Details

Date

Contact

Michael Simpson, Principal Research Associate, Urban Institute Health Policy Center

[email protected]

Citation

Michael Simpson, Andrew Green, and Jessica S. Banthin, How Policies to Expand Insurance Coverage Affect Household Health Care Spending (Commonwealth Fund, Jan. 2023). https://doi.org/10.26099/fv5e-sh06