
Advanced Search

Advanced Search

Current Filters

Filter your query

Publication Types

Other

to

Issue Briefs

/

High U.S. Health Care Spending: Where Is It All Going?

Photo, hands paying in cash for prescription at a pharmacy counter

Debra Tyler pays out of pocket for her daughter’s prescription at their local pharmacy in Killingworth, Conn. The U.S. spends more than twice as much per capita annually on retail prescription drugs as the average of 12 comparator OECD countries. Photo: Joe Buglewicz for the Washington Post via Getty Images

Debra Tyler pays out of pocket for her daughter’s prescription at their local pharmacy in Killingworth, Conn. The U.S. spends more than twice as much per capita annually on retail prescription drugs as the average of 12 comparator OECD countries. Photo: Joe Buglewicz for the Washington Post via Getty Images

Toplines
  • Administrative costs, prescription drugs, and physician and nurse wages may be contributing factors to excess health spending in the United States, compared with peer nations

  • The majority of “excess” U.S. health spending is associated with components likely reflected in higher U.S. prices, while utilization may explain a large portion of the remainder

Abstract

  • Issue: The United States spends twice as much per person on health as peer nations. Current research points to higher prices as a driving factor, but less is known about how the dollars associated with higher U.S. prices and spending are distributed.
  • Goals: To identify and estimate components of excess U.S. health spending relative to peer nations.
  • Methods: Review of published and grey literature comparing international health systems and analysis of Organisation for Economic Co-operation and Development (OECD) Health Statistics data with other public data.
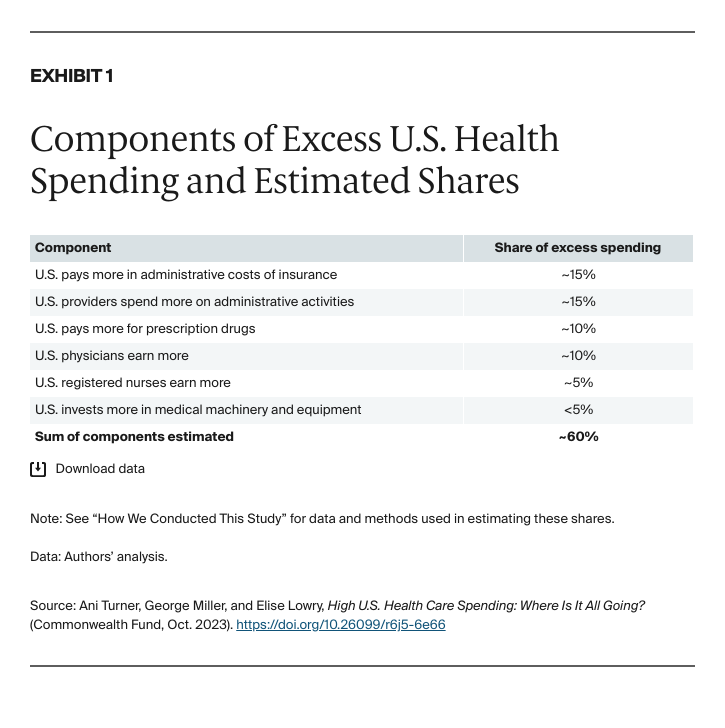
  • Key Findings and Conclusion: More than half of excess U.S. health spending was associated with factors likely reflected in higher prices, including more spending on: administrative costs of insurance (~15% of the excess), administrative costs borne by providers (~15%), prescription drugs (~10%), wages for physicians (~10%) and registered nurses (~5%), and medical machinery and equipment (less than 5%). Reductions in administrative burdens and drug costs could substantially reduce the difference between U.S. and peer nation health spending.

Introduction

The United States spends twice as much per person on health as the average of peer nations.1 A number of studies have concluded that high prices are a major driver of this “excess” spending.2 A better understanding of where the excess health spending is going can guide strategies to address high spending and shed light on the populations most likely to be affected.

We examined published research, grey literature, and Organisation for Economic Co-operation and Development (OECD) data for the U.S. and comparator countries to identify potential components of higher U.S. health spending and, where possible, to estimate the order of magnitude of each component. It’s important to note that while our research was aimed at estimating “excess” spending, we were not able to definitively identify or quantify all components.

Components of Excess U.S. Health Care Spending

We were able to find evidence to support more than half of the difference in per capita health spending between the United States and the average of 12 comparator OECD countries (Exhibit 1). The components we estimated are all associated with higher prices, rather than being utilization effects.

Turner_high_us_health_care_spending_Exhibit_01

Administrative Costs: About 30 Percent

We estimate that higher administrative costs associated with health insurance — for example, those related to eligibility, coding, submission, and rework — represent approximately 15 percent of excess U.S. health spending. Higher administrative burden on providers — for example, general administration, human resources, and quality reporting and accreditation — represents an additional 15 percent of the excess. This makes administrative complexity the single biggest component of excess U.S. spending estimated in this study. The large impact of administrative costs is consistent with previous research that found 39 percent of the difference between U.S. and Canadian spending on hospital and physician care was administration.3

Salary and Wages for Physicians and Nurses: About 15 Percent

OECD and international survey data show that physicians and registered nurses (RNs) in the U.S. are paid more than the average of comparator countries, with physicians earning about twice as much and RNs 1.5 times as much. These wages are determined in the context of U.S. labor markets and also may be influenced by higher levels of educational debt. Nevertheless, we estimate that higher wages for these two key health care occupations may explain a combined 15 percent of excess U.S. health spending relative to other countries.

Prescription Drugs: About 10 Percent

This estimate is based on data showing that the U.S. spends twice as much per person on retail prescription drugs, which may include differences in both utilization and price. U.S. prescription drug prices are two to three times those in other OECD countries.4 While the U.S. compares favorably on prices for unbranded generic drugs, U.S. prices are much higher for branded drugs, which account for approximately 80 percent of prescription drug expenditures in the U.S.5 Therefore, we consider this component to primarily represent a price effect.

Medical Machinery and Equipment: Less Than 5 Percent

We hypothesized that a potential driver of higher U.S. spending was higher capital costs associated with more frequent construction and modernization of facilities. However, OECD data comparing capital expenditures on health did not show the U.S. spending more for construction costs. Only in the capital investment subcategory of “medical machinery and equipment” did the data show U.S. expenditures were higher than comparator countries, corresponding to a modest impact of less than 5 percent of excess U.S. spending, approximately.

Possible Additional Excess Spending Reflected in Higher Prices

In this study, we examined several drivers of excess U.S. spending that would likely be reflected in higher prices, including: labor costs for physicians and RNs; capital costs; administrative costs; and profits.

There are other possible components of excess spending that could be reflected in higher prices that we were not able to estimate and that may be worth further exploration. These include labor costs for other workers in health care, as well as low-value care and fraud.

Labor Costs Other Than Those for Nurses and Physicians

Labor cost differences in our estimates include the impact of differences in wages for physicians and registered nurses and the impact of greater numbers of administrative staff reflected in higher provider administrative costs. We were not able to estimate differences in wages or numbers of workers for other types of health care providers, or for any of the health care support occupations and nonhealth occupations working in health care.

OECD data on total health employment indicate that the overall size of the health workforce in the U.S. is at or slightly below that of comparator countries, with the U.S. employing 64 people per 1,000 population in health, while comparator countries averaged 70 employees per 1,000 people.6 However, wages and the mix of occupations employed in health across countries may differ in ways that affect labor costs beyond what this study has captured.

Low-Value Care and Fraud

We did not estimate spending associated with two areas commonly identified as “waste” in health care — low-value clinical care and fraud. These areas are appropriate targets for health care cost reduction, but we did not find comparative data or strong evidence that low-value care and fraud are experienced more in the U.S. compared with other countries.7

Role of Health Service Use and Intensity in Higher U.S. Spending

We hypothesize that a sizable share of U.S. health spending not explained by our estimates may be because of differences in health care utilization when the definition of utilization is broadened to include the “intensity” of care (the range of services provided per visit or hospital stay), and the use of services outside hospitals and office settings. We found some evidence supporting this hypothesis, summarized below, but more robust research and analysis is required.

U.S. Patients May Receive a Greater Range of Health Services

There are several reasons why differences in service intensity may be a major factor in higher U.S. spending. First, we find evidence that patients in the U.S. receive a greater intensity of treatment per visit or hospital day, including greater access to and use of advanced diagnostic and treatment technologies, one area in which the U.S. ranks highly on supply. For example, a published analysis of OECD data shows a 44 percent higher rate of magnetic resonance imaging (MRI) exams and 62 percent higher rate of computed tomography (CT) scans in the U.S. compared with an OECD average.8 In another study, rates of coronary artery bypass graft surgery were 50 percent to 100 percent higher in the U.S. for patients with acute myocardial infarction.9

Second, we find evidence from comparative studies of well-defined procedures and patient populations that the U.S. provides more services in settings that are not as consistently tracked in the OECD data across countries, such as postacute care or specialty outpatient care, especially for high-need patients.10 In fact, the relatively low U.S. lengths of stay are consistent with a greater push to postacute and more intensive ambulatory settings.

U.S. Patients May Be Sicker Than Peers in Other Countries

In assessing potential utilization differences, it also may be useful to consider whether there is a greater underlying need for services in the U.S. We do not see evidence that the U.S. population is older on average than most peer nations. However, the U.S. population is sicker in ways that may increase the intensity of care required. OECD data indicate higher U.S. rates of obesity, diabetes, and heart disease, and a larger share of the population with multiple chronic conditions. Recent research has explored the extent to which the U.S. spends relatively less on prevention and public health and more on medical care, and the extent to which this leads to poorer population health.11

We also examined the potential impact of higher rates of assault and violence, as the U.S. is an extreme outlier in this regard. Notwithstanding the human toll, our initial estimate is that increased health care utilization resulting from higher rates of assault and violence accounts for a relatively modest 1 percent of excess U.S. spending.

Adjusting for Cost-of-Living Doesn’t Explain Spending Differences

Another piece of evidence pointing to a utilization impact on higher U.S. spending comes from analyses of international purchasing power parity (PPP) adjustments. In comparing spending by country, data are first converted to a common currency, such as U.S. dollars. The OECD health spending data used in our study were also subject to PPP adjustments that essentially adjust for differences in costs of living between countries.

In addition to the economywide PPP adjustments typically applied, the OECD has developed health care–specific PPP adjustments that reflect price comparisons of a market basket of readily comparable health care goods and services (160 drugs, 24 products, 37 hospital services, and 49 other services). Adjusting for these select health care unit price differences brings U.S. spending closer to other countries but still leaves some difference unexplained, suggesting a remaining utilization effect.12

Discussion

Some of the factors that receive a lot of attention in comparing the U.S. with other countries did turn out to be impactful, according to our estimates, with administrative costs, drug spending, and wages for physicians and nurses topping the list. Others such as higher capital costs and higher rates of violence were not associated with excess spending.

The factors we were able to estimate tended to relate to input costs and were therefore likely to be reflected in higher prices, consistent with the large body of research pointing to price differences as a major factor in high U.S. spending. Still, our estimates leave approximately half of excess U.S. spending unexplained.

Conclusion

This study is a first attempt at quantifying drivers of the difference in per capita health spending between the United States and peer nations. Most of the estimates were based on computing potential savings if the U.S. spent at the comparator country average using OECD data for the most recent year or years available. OECD data vary by year and by country in completeness and comparability, so these figures should be viewed as initial estimates. We had more success estimating components likely reflected in higher U.S. prices, which were associated with approximately half of “excess” U.S. spending.

The findings suggest that reductions in administrative burdens, drug costs, and wages for physicians and nurses have the potential to substantially reduce the difference between U.S. and peer nation health spending. A more detailed understanding of international differences in health care utilization, including intensity and modalities of care, is an important aim for future research.

HOW WE CONDUCTED THIS STUDY

The goal of this study was to compile the best current, available evidence on what “excess” U.S. spending is associated with. However, because of limitations in data available to fully identify and measure each component, this should not be considered an exhaustive study; rather, it represents a preliminary step in identifying and quantifying components of excess spending.

We reviewed peer-reviewed and grey literature on:

  • characteristics of international health systems
  • comparisons of the United States with peer nations in components of health spending
  • the supply of health care goods and services, and health input costs
  • studies of components and drivers of U.S. health care prices
  • studies of “waste” in the U.S. health system.

We supplemented existing research with our own analysis of OECD Health Statistics data,13 U.S. national health expenditure (NHE) estimates,14 and other public data sources to estimate the order of magnitude of each potential component of excess U.S. health spending. The general approach was to compute an estimated dollar savings if the U.S. spent the average of comparator countries on that component, and then to relate that dollar amount to the corresponding year’s NHE to compute a percentage. Given that U.S. per capita health spending is twice the OECD average, the excess is 50 percent of NHE, so doubling the share of NHE represented by the savings produced an estimate of the share of the excess. Our estimates are rounded to the nearest multiple of five.

Consistent with other recent international health spending comparisons,15 we used the following 12 OECD countries for comparison: Australia, Canada, France, Germany, Japan, Korea, Netherlands, New Zealand, Norway, Sweden, Switzerland, and the United Kingdom, collectively abbreviated as OECD12 in this section. Data and methods for each component are summarized below.

Administrative Costs of Insurance

OECD Health Statistics data show the U.S. spent $1,055 per person on “governance and health system financing administration” in 2020, compared with the OECD12 average of $193 per person. We multiplied the difference in per capita spending by the size of the 2020 U.S. population to estimate potential savings of $285.6 billion, or about 7 percent of 2020 U.S. NHE, translating to about 15 percent of “excess” U.S. health spending when rounded to the nearest multiple of five.

Administrative Costs to Providers

A 2021 study by McKinsey estimates hospital administrative costs at $250 billion and clinical services administrative costs at $205 billion, representing 21 percent and 27 percent respectively of 2019 NHE spending in these settings.16 A 2014 study by Himmelstein and colleagues comparing hospital administrative costs for the U.S. and five comparator countries found that the other countries spent 42 percent less than the U.S. on hospital administration.17 We multiplied 2021 NHE estimates of spending by setting by 21 percent or 27 percent to estimate administrative costs, then approximated 42 percent of those costs18 to produce an estimate of $276 billion in potential savings, or about 6.5 percent of 2021 U.S. NHE, translating to about 15 percent of excess U.S. health spending when rounded to the nearest multiple of five.

A recent study using time-driven activity-based costing to compare billing and insurance-related costs for inpatient care confirms high U.S. provider administrative costs and finds that much of difference is attributable to high coding costs.19

Prescription Drugs

OECD Health Statistics data show the U.S. spends more than twice as much per capita annually on retail prescription drugs as the OECD12 average, $1,126 versus $536 per person. As U.S. retail drug spending is about 9 percent of NHE, cutting this spending in half would represent 4.5 percent of NHE, or approximately 10 percent of excess U.S. health spending when rounded to the nearest multiple of five.

Physician Salaries

Data from the Medscape International Physician Compensation Report 2021 show a ratio of average physician pay in the U.S. to other countries was 1.7 to 1 for primary care and 2.6 to 1 for specialists.20 Using numbers of U.S. primary care and specialist physicians from the Kaiser Family Foundation,21 we computed total physician earnings using average U.S. pay and other country average pay. The difference was $167 billion, or about 4 percent of 2021 NHE, representing approximately 10 percent of excess U.S. spending when rounded to the nearest multiple of five.

Registered Nurse Salaries

OECD Health Statistics data show U.S. registered nurses (RNs) earn 1.5 times the OECD12 average salary. These data are adjusted for purchasing power parity. Using numbers of RNs in the U.S. from the Bureau of Labor Statistics,22 we computed total RN earnings using average U.S. pay and OECD12 average pay. The difference was $79 billion, or about 2 percent of 2021 NHE, representing approximately 5 percent of excess U.S. spending when rounded to the nearest multiple of five.

Medical Machinery and Equipment

OECD Health Statistics data on “annual capital expenditure on health as a share of GDP” presented as an average from 2015 through 2019 show that the U.S. spends about 80 percent more, or 0.2 percent of GDP more than the OECD12 average on the subcategory of “machinery and equipment.” We multiplied 2021 U.S. GDP from the Bureau of Economic Analysis by 0.2 percent to produce an estimate of $46 billion, or about 1 percent of 2021 NHE, representing less than 5 percent of excess spending when rounded to the nearest multiple of five.

Note that these data also show that the U.S. spends about 40 percent less than the comparator countries on another category of capital expenditure, construction of health care facilities. Since our goal was to better understand contributors to higher U.S. spending and we view facilities construction as separate from machinery and equipment, we did not compute any offset for this category of lower spending.

Higher Rates of Assault and Violence

OECD data show rates of “death per 100,000 population due to assault” in the U.S. are nearly 10 times higher than the OECD12 average taken during the past five years (this ratio increased to 12.8 in 2020 but we used the five-year average as 2020 may be anomalous). A Centers for Disease Control and Prevention study estimated numbers of U.S. homicides and intentional injuries in 2019 and average medical care costs associated with death and injury because of assault and violence.23 We computed excess U.S. deaths and nonfatal injuries assuming a similar disparity in injuries to the differential OECD mortality rates. We then multiplied the number of excess deaths and injuries to the corresponding CDC estimated medical care costs to produce an estimate of $21 billion, or about 0.56 percent of NHE and about 1 percent of excess U.S. health spending.

NOTES
  1. Munira Z. Gunja, Evan D. Gumas, and Reginald D. Williams II, U.S. Health Care from a Global Perspective, 2022: Accelerating Spending, Worsening Outcomes (Commonwealth Fund, Jan. 2023).
  2. Gerard F. Anderson, Peter Hussey, and Varduhi Petrosyan, “It’s Still the Prices, Stupid: Why the U.S. Spends So Much on Health Care, and a Tribute to Uwe Reinhardt,” Health Affairs 38, no. 1 (Jan. 2019): 87–95.
  3. Alexis Pozen and David M. Cutler, “Medical Spending Differences in the United States and Canada: The Role of Prices, Procedures, and Administrative Expenses,” Inquiry 47, no. 2 (Summer 2010): 124–34.
  4. Andrew W. Mulcahy et al., International Prescription Drug Price Comparisons (RAND Corp., Jan. 2021).
  5. Sonal Parasrampuria and Stephen Murphy, Trends in Prescription Drug Spending, 2016–2021 (Office of the Assistant Secretary for Planning and Evaluation, U.S. Department of Health and Human Services, Sept. 2022).
  6. Average of 2016 through 2020 data. Health and social employment includes International Standard Industrial Classification codes 86: human health activities; 87: residential care; and 88: social work activities without accommodation.
  7. Organisation for Economic Co-operation and Development, Tackling Wasteful Spending on Health (OECD, Jan. 2017).
  8. Irene Papanicolas, Liana R. Woskie, and Ashish K. Jha, “Health Care Spending in the United States and Other High-Income Countries,” JAMA 319, no. 10 (Mar. 13, 2018): 1024–39.
  9. Peter Cram et al., “Variation in Revascularisation Use and Outcomes of Patients in Hospital with Acute Myocardial Infarction Across Six High Income Countries: Cross Sectional Cohort Study,” BMJ 377 (May 4, 2022): e069164.
  10. Irene Papanicolas et al., “Differences in Health Care Spending and Utilization Among Older Frail Adults in High-Income Countries: ICCONIC Hip Fracture Persona,” Health Services Research 56, no. 53 (Dec. 2021): 1335–46; and Luca Lorenzoni et al., “Why the U.S. Spends More Treating High-Need High-Cost Patients: A Comparative Study of Pricing and Utilization of Care in Six High-Income Countries,” Health Policy 128 (Feb. 2023): 55–61.
  11. Elizabeth H. Bradley and Amanda L. Brewster, “Untangling the Relationship Between Social Service and Health Care Spending and Health Outcomes,” Health Affairs Forefront (blog), Nov. 18, 2019.
  12. Luca Lorenzoni and Sean Dougherty, “Understanding Differences in Health Care Spending: A Comparative Study of Prices and Volumes Across OECD Countries,” Health Services Insights 15 (June 23, 2022): 1–8.
  13. Organisation for Economic Co-operation and Development, Health at a Glance 2021: OECD Indicators (OECD, Nov. 9, 2021).
  14. National Health Expenditure Data: Historical,” Centers for Medicare and Medicaid Services, accessed Feb. 22, 2023.
  15. Gunja, Gumas, and Williams, U.S. Health Care from a Global Perspective, 2023.
  16. Nikhil R. Sahni et al., Administrative Simplification: How to Save a Quarter-Trillion Dollars in U.S. Healthcare (McKinsey & Co., Oct. 2021).
  17. David U. Himmelstein et al., “A Comparison of Hospital Administrative Costs in Eight Nations: U.S. Costs Exceed All Others by Far,” Health Affairs 33, no. 9 (Sept. 2014): 1586–94.
  18. These estimates are likely to reflect the higher end of the range for administrative costs, as the 42 percent share associated with hospitals is likely larger than the share for provider administrative costs.
  19. Barak D. Richman et al., “Billing and Insurance-Related Administrative Costs: A Cross-National Analysis,” Health Affairs 41, no. 8 (Aug. 2022): 1098–106.
  20. Leslie Kane et al., “International Physician Compensation Report 2021: Do U.S. Doctors Have It Better?” Medscape, Aug. 20, 2021.
  21. State Health Facts, “Professionally Active Physicians, Timeframe: January 2023,” Henry J. Kaiser Family Foundation, n.d., accessed Feb. 7, 2023.
  22. Bureau of Labor Statistics, Occupational Outlook Handbook: Registered Nurses (U.S. Department of Labor, Sept. 8, 2022).
  23. Cora Peterson et al., “Economic Cost of Injury — United States, 2019,” Morbidity and Mortality Weekly Report (MMWR) 70, no. 48 (Dec. 3, 2021): 1655–59.

Publication Details

Date

Contact

Erin Butto, Senior Director, Applied Research and Analytics, Altarum

[email protected]

Citation

Ani Turner, George Miller, and Elise Lowry, High U.S. Health Care Spending: Where Is It All Going? (Commonwealth Fund, Oct. 2023). https://doi.org/10.26099/r6j5-6e66