
Advanced Search

Advanced Search

Current Filters

Filter your query

Publication Types

Other

to

Issue Briefs

/

U.S. Health Care from a Global Perspective, 2022: Accelerating Spending, Worsening Outcomes

A doctor and nurses tend to a patient at University Hospital Leipzig on Nov. 18, 2021, in Leipzig, Germany. Germany spends less on health care per capita than the U.S., yet life expectancy at birth is nearly four years higher. Photo: Jens Schlueter/Getty Images

A doctor and nurses tend to a patient at University Hospital Leipzig on Nov. 18, 2021, in Leipzig, Germany. Germany spends less on health care per capita than the U.S., yet life expectancy at birth is nearly four years higher. Photo: Jens Schlueter/Getty Images

A doctor and nurses tend to a patient at University Hospital Leipzig on Nov. 18, 2021, in Leipzig, Germany. Germany spends less on health care per capita than the U.S., yet life expectancy at birth is nearly four years higher. Photo: Jens Schlueter/Getty Images

Toplines
  • The U.S. spends nearly 18 percent of GDP on health care, yet Americans die younger and are less healthy than residents of other high-income countries

  • Not only does the U.S. have the lowest life expectancy among high-income countries, but it also has the highest rates of avoidable deaths

Introduction

In the previous edition of U.S. Health Care from a Global Perspective, we reported that people in the United States experience the worst health outcomes overall of any high-income nation.1 Americans are more likely to die younger, and from avoidable causes, than residents of peer countries.

Between January 2020 and December 2021, life expectancy dropped in the U.S. and other countries.2 With the pandemic a continuing threat to global health and well-being, we have updated our 2019 cross-national comparison of health care systems to assess U.S. health spending, outcomes, status, and service use relative to Australia, Canada, France, Germany, Japan, the Netherlands, New Zealand, Norway, South Korea, Sweden, Switzerland, and the United Kingdom. We also compare U.S. health system performance to the OECD average for the 38 high-income countries for which data are available. The data for our analysis come from the Organisation for Economic Co-operation and Development (OECD) and other international sources (see “How We Conducted This Study” for details).

For every metric we examine, we used the latest data available. This means that results for certain countries may reflect the height of the COVID-19 pandemic, when mental health conditions were surging, essential health services were disrupted, and patients may not have received the same level of care.3

Highlights

  • Health care spending, both per person and as a share of GDP, continues to be far higher in the United States than in other high-income countries. Yet the U.S. is the only country that doesn’t have universal health coverage.
  • The U.S. has the lowest life expectancy at birth, the highest death rates for avoidable or treatable conditions, the highest maternal and infant mortality, and among the highest suicide rates.
  • The U.S. has the highest rate of people with multiple chronic conditions and an obesity rate nearly twice the OECD average.
  • Americans see physicians less often than people in most other countries and have among the lowest rate of practicing physicians and hospital beds per 1,000 population.
  • Screening rates for breast and colorectal cancer and vaccination for flu in the U.S. are among the highest, but COVID-19 vaccination trails many nations.

Findings

Health Care Spending and Coverage

Gunja_us_health_care_global_perspective_2022_Exhibit_01

In all countries, health spending as a share of the overall economy has been steadily increasing since the 1980s, as spending growth has outpaced economic growth.4 This growth is in part because of medical technologies, rising prices in the health sector, and higher demand for services.5 In 2020, when the COVID-19 pandemic began, health care spending rose rapidly in nearly all countries, as governments sought to mitigate the spread of the disease through COVID testing, vaccine development, relief funds, and other measures.6 Since then, spending has slowed but still remains higher from years prior.7

In 2021, the U.S. spent 17.8 percent of gross domestic product (GDP) on health care, nearly twice as much as the average OECD country.

Gunja_us_health_care_global_perspective_2022_Exhibit_02

Health spending per person in the U.S. was nearly two times higher than in the closest country, Germany, and four times higher than in South Korea. In the U.S., that includes spending for people in public programs like Medicaid, the Children’s Health Insurance Program, Medicare, and military plans; spending by those with private employer-sponsored coverage or other private insurance; and out-of-pocket health spending.

Gunja_us_health_care_global_perspective_2022_Exhibit_03

All countries in this analysis, except the U.S., guarantee government, or public, health coverage to all their residents. In addition to public coverage, people in several of the countries have the option to also purchase private coverage. In France, nearly the entire population has both private and public insurance.

In 2021, 8.6 percent of the U.S. population was uninsured.8 The U.S. is the only high-income country where a substantial portion of the population lacks any form of health insurance.

Health Outcomes

Gunja_us_health_care_global_perspective_2022_Exhibit_04

Despite high U.S. spending, Americans experience worse health outcomes than their peers around world. For example, life expectancy at birth in the U.S. was 77 years in 2020 — three years lower than the OECD average. Provisional data shows life expectancy in the U.S. dropped even further in 2021.9

In the U.S., life expectancy masks racial and ethnic disparities.10 Average life expectancy in 2019 for non-Hispanic Black Americans (74.8 years) and non-Hispanic American Indians or Alaska Natives (71.8 years) is four and seven years lower, respectively, than it is for non-Hispanic whites (78.8 years).

Meanwhile, life expectancy for Hispanic Americans (81.9 years) is higher than it is for whites and similar to life expectancy in the Netherlands, New Zealand, and Canada. As a group, Asian Americans have a higher life expectancy (85.6 years) than people in Japan.

Gunja_us_health_care_global_perspective_2022_Exhibit_05

Avoidable mortality refers to deaths that are preventable and treatable. Preventable deaths can be avoided through effective public health measures and through primary prevention, such as nutritional diet and exercise. Treatable mortality can be avoided mainly through timely and effective health care interventions, including regular exams, screenings, and treatment.11 Since 2015, avoidable deaths have been on the rise in the U.S., which had the highest rate in 2020 of all the countries in our analysis.

Gunja_us_health_care_global_perspective_2022_Exhibit_06

In 2020, the infant mortality rate in the U.S. was 5.4 deaths per 1,000 live births, the highest rate of all the countries in our analysis. In contrast, there were 1.6 deaths per 1,000 live births in Norway.

Women in the U.S. have long had the highest rate of maternal mortality related to complications of pregnancy and childbirth. In 2020, there were nearly 24 maternal deaths for every 100,000 live births in the U.S., more than three times the rate in most of the other high-income countries we studied. A high rate of cesarean section, inadequate prenatal care, and socioeconomic inequalities contributing to chronic illnesses like obesity, diabetes, and heart disease may all help explain high U.S. infant and maternal mortality.12

Gunja_us_health_care_global_perspective_2022_Exhibit_07

Elevated suicide rates, which have dramatically increased during the COVID-19 pandemic, can indicate a high burden of mental illness.13 The U.S. has the third-highest suicide rate, while the U.K. has the lowest — nearly half the U.S. rate.

Gunja_us_health_care_global_perspective_2022_Exhibit_08

The U.S. is an outlier in deaths from physical assault, which includes gun violence. Its 7.4 deaths per 100,000 people is far above the OECD average of 2.7, and at least seven times higher than all other high-income countries in our study, except New Zealand.

Health Status

Gunja_us_health_care_global_perspective_2022_Exhibit_09

Obesity is a key risk factor for chronic conditions such as diabetes, hypertension and other cardiovascular diseases, and cancer. Issues that contribute to obesity include unhealthy living environments, less-regulated food and agricultural sectors, lower socioeconomic status, and higher rates of behavioral health problems.14

The U.S. has the highest obesity rate among the countries we studied, where data was available — nearly two times higher than the OECD average.

Gunja_us_health_care_global_perspective_2022_Exhibit_10

In 2020, three of 10 U.S. adults surveyed said at some point in their lifetime they had been diagnosed with two or more chronic conditions such as asthma, cancer, depression, diabetes, heart disease, or hypertension. No more than a quarter of residents in the other countries studied reported the same, and the U.S. rate was nearly twice as high as France’s.

Gunja_us_health_care_global_perspective_2022_Exhibit_11

Since the start of the COVID-19 pandemic, more people in the U.S. have died from the coronavirus than any in any other high-income country. For every 1 million cases between January 22, 2020, and January 18, 2023, there were more than 3,000 deaths in the U.S.

Health Care Use

Gunja_us_health_care_global_perspective_2022_Exhibit_12

While U.S. health care spending is the highest in the world, Americans overall visit physicians less frequently than residents of most other high-income countries. At four visits per person per year, Americans see the doctor less often than the OECD average.

Less-frequent physician visits may be related to the comparatively low supply of physicians in the U.S., which is below the average number of practicing physicians in OECD countries.

Gunja_us_health_care_global_perspective_2022_Exhibit_13

The average length of a hospital stay in the U.S. for all inpatient care was 4.8 days, far lower than the OECD average. The U.S. had 2.8 hospital beds per 1,000 population, lower than the OECD average of 4.3.

Gunja_us_health_care_global_perspective_2022_Exhibit_14

More than two-thirds of older Americans receive the flu vaccine, similar to older residents of several other high-income countries, and more than the OECD average.

The U.S., however, has one of the lowest COVID-19 vaccination rates among high-income countries. As of January 2023, 69 percent of the population were fully vaccinated, compared to 86 percent in South Korea, although rates are regularly being updated.

Gunja_us_health_care_global_perspective_2022_Exhibit_15

The U.S. does relatively well with cancer prevention. This is likely a reflection of extensive screening and detection, a key to diagnosing breast and colorectal cancers early and beginning treatment in a timely manner.15

The U.S. and Sweden had the highest number of breast cancer screenings among women ages 50 to 69, notably higher than the OECD average. In contrast, just 43 percent of women ages 50 to 69 were screened in France. When it comes to colorectal cancer screening, the U.S. exceeded the OECD average and had among the highest rates.

Gunja_us_health_care_global_perspective_2022_Exhibit_16

Magnetic resonance imaging, or MRI, is a common and effective imaging technique for diagnosing and tracking the treatment of a variety of illnesses. The countries that use these specialized scans the most are the U.S., Japan, France, Norway, and Germany, with more than 100 scans per 1,000 people.

The U.S. has a high number of MRI units available to physicians, about 38 units for every 1 million people in 2018. That’s the second-highest rate in the world behind Japan, which has 51.7 units per 1 million people.16

While their clinical benefit as a diagnostic tool is well documented, MRIs are particularly expensive in the U.S., averaging $1,119.17 That’s 42 percent more than the U.K.’s average cost and 420 percent more than Australia’s. And while MRIs are accessible in the U.S., Americans spend far more on them than their international peers do.18

Gunja_us_health_care_global_perspective_2022_Exhibit_17

Globally, rates of hip replacement are increasing as populations age and develop conditions like osteoarthritis — the leading reason for the procedure, which can substantially improve an individual’s quality of life.19 Hip replacements are an important indicator of the prevalence of osteoarthritis in a population.

Discussion

While the United States spends more on health care than any other high-income country, the nation often performs worse on measures of health and health care. For the U.S., a first step to improvement is ensuring that everyone has access to affordable care. Not only is the U.S. the only country we studied that does not have universal health coverage, but its health system can seem designed to discourage people from using services.

Affordability remains the top reason why some Americans do not sign up for health coverage, while high out-of-pocket costs lead nearly half of working-age adults to skip or delay getting needed care.20 The Inflation Reduction Act, which will help reduce the high cost of certain drugs and cap out-of-pocket costs for older Americans, is a step in the right direction.21 But it will take much more to make health care as easy to access as it is in other high-income countries.

A second step is containing costs. Other countries have achieved better health outcomes while spending much less on health care overall. In the U.S., high prices for health services continue to be the primary driver of this elevated spending.22 U.S. policymakers and health systems could look to some of the approaches taken by other nations to contain overall health spending, including health care and administrative costs.

A third step is better prevention and management of chronic conditions. Critical to this is developing the capacity to offer comprehensive, continuous, well-coordinated care. Decades of underinvestment, along with an inadequate supply of health care providers, have limited many Americans’ access to effective primary care.23

The findings of our international comparison demonstrate the importance of a health care system that supports chronic disease prevention and management, the early diagnosis and treatment of medical problems, affordable access to health care coverage, and cost containment — among the key functions of a high-performing system. Other countries have found ways to do these things well; the U.S. can as well.

ACKNOWLEDGMENTS

The authors thank Chris Hollander, David Blumenthal, Melinda Abrams, Jen Wilson, Paul Frame, Bethanne Fox, Celli Hortsman, Lauren Haynes, and Relebohile Masitha, all of the Commonwealth Fund, for helpful comments on earlier versions of the brief and for editorial support.

HOW WE CONDUCTED THIS STUDY

Data Sources and Methods

Organisation for Economic Co-operation and Development

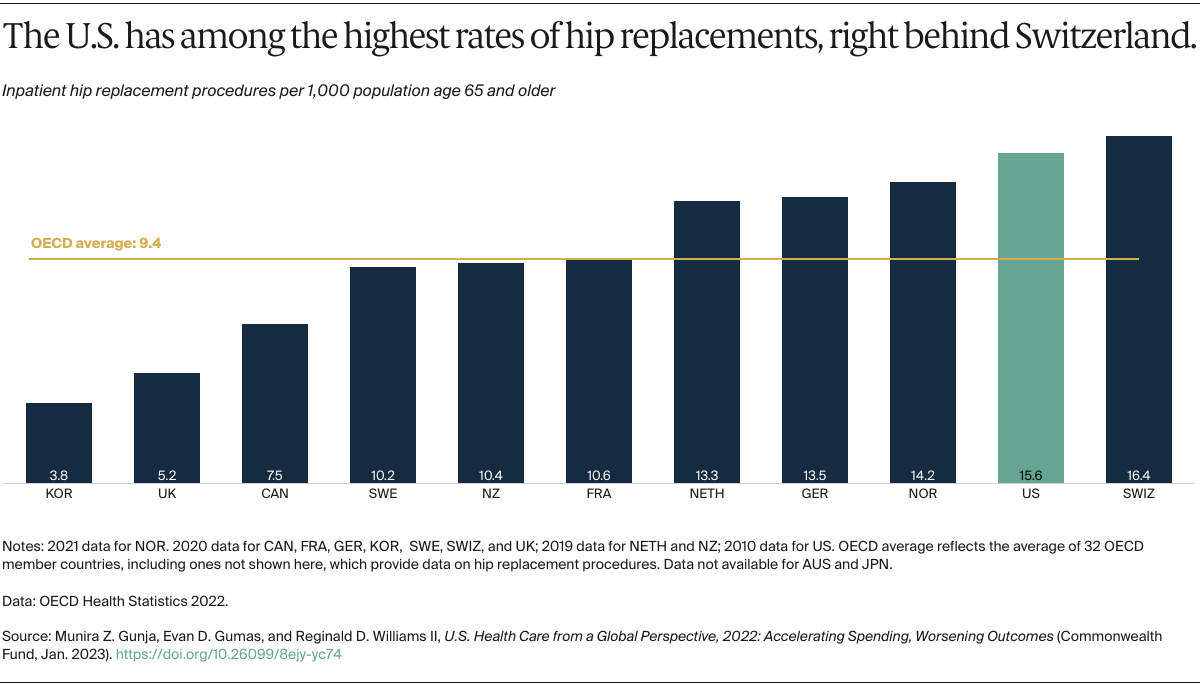
This analysis used data from the 2022 release of health statistics compiled by the Organisation for Economic Cooperation and Development (OECD), which tracks and reports on a wide range of health system measures across 38 high-income countries. Data were extracted in December 2022. While data collected by the OECD reflect the gold standard in international comparisons, one limitation is that data may mask differences in how countries collect their health data. Full details on how indicators were defined, as well as country-level differences in definitions, are available from the OECD.24

2020 Commonwealth Fund International Health Policy Survey

For the 2020 Commonwealth Fund International Health Policy Survey, data were collected from nationally representative samples of noninstitutionalized adults age 18 and older in Australia, Canada, France, Germany, the Netherlands, New Zealand, Norway, Switzerland, Sweden, the United Kingdom, and the United States. Samples were generated using probability-based overlapping landline and mobile phone sampling designs in all but three countries. In Norway, Sweden, and Switzerland, respondents were randomly selected from listed or nationwide population registries. In the U.S., an address-based sampling frame was also incorporated to ensure a representative sample of respondents. Respondents completed surveys via landline and mobile phones, as well as online, in Sweden, Switzerland, and the U.S.

International partners cosponsored surveys, and some supported expanded samples to enable within-country analyses. Final country samples ranged from 607 to 4,530 participants. The survey research firm SSRS was contracted to conduct the survey with country contractors from February through May 2020. The field period across countries ranged from four to 15 weeks. Response rates varied from 14 percent to 49 percent. Data were weighted using country-specific demographic variables to account for differences in sample design and probability of selection.

Our World in Data

This analysis used data from Our World in Data, which compiles data from most countries and territories around the world across a range of measures. Data for confirmed COVID-19 deaths and COVID-19 vaccination rates were extracted in January 2023. A limitation of both data sets is that they only report confirmed deaths and reported vaccination rates, which Our World in Data notes can be underestimates. Full details on how indicators are defined, as well as country-level differences in data collection, are available from Our World in Data.25

Limitations of Our Analysis

The effects of the COVID-19 pandemic, including job loss and the postponement or forgoing of needed care, likely worsened many health outcomes.26 Therefore, some of our cross-country analyses should be interpreted with caution, as data for 2020 and beyond were not available for all countries or for every measure. As businesses and health care facilities continue to reopen and return to pre-COVID levels of operation, the health burdens individuals faced globally during the pandemic may continue to linger.

Another limitation of our study is that are we were unable to break out the data by race and ethnicity. Research has uncovered huge health disparities in the U.S., particularly for Black and Latino Americans.27 Efforts to collect data by race and ethnicity are needed on a global level to allow policymakers to not only make cross-country comparisons but also to see how health outcomes compare among vulnerable and historically neglected populations around the world.

NOTES
  1. Roosa Tikkanen and Melinda K. Abrams, U.S. Health Care from a Global Perspective, 2019: Higher Spending, Worse Outcomes? (Commonwealth Fund, Jan. 2020).
  2. Bridget M. Kuehn, “COVID-19 Cuts Life Expectancy in Dozens of Countries,” JAMA 327, no. 3 (Jan. 18, 2022): 209.
  3. World Health Organization, “COVID-19 Continues to Disrupt Essential Health Services in 90% of Countries,” news release, Apr. 23, 2021.
  4. Luca Lorenzoni et al., Health Spending Projections to 2030: New Results Based on a Revised OECD Methodology, OECD Health Working Papers, no. 110 (Organisation for Economic Co-operation and Development, May 2019).
  5. David Morgan, “How Much Is Too Much? Value for Money in Health Spending,” in Value for Money in Health Spending (Organisation for Economic Co-operation and Development, Oct. 2010), 21–42.
  6. Office of the Actuary, “National Health Spending in 2020 Increases Due to Impact of COVID-19 Pandemic,” press release, Centers for Medicare and Medicaid Services, Dec. 15, 2021; and World Health Organization, Global Spending on Health: Rising to the Pandemic’s Challenges (WHO, 2022).
  7. Anne B. Martin et al., “National Health Care Spending in 2021: Decline in Federal Spending Outweighs Greater Use of Health Care,” Health Affairs 42, no. 1 (Jan. 2023): 6–17.
  8. Amy E. Cha and Robin A. Cohen, “Demographic Variation in Health Insurance Coverage: United States, 2021,” National Health Statistics Report, no. 177 (Centers for Disease Control and Prevention, U.S. Department of Health and Human Services, Nov. 3, 2022).
  9. National Center for Health Statistics, “Life Expectancy in the U.S. Dropped for the Second Year in a Row in 2021,” news release, Centers for Disease Control and Prevention, Aug. 31, 2022.
  10. Elizabeth Arias and Jiaquan Xu, “United States Life Tables, 2019,” National Vital Statistics Reports 70, no. 19 (March 22, 2022).
  11. Organisation for Economic Co-operation and Development, Avoidable Mortality: OECD/Eurostat Lists of Preventable and Treatable Causes of Death (January 2022 Version) (OECD, Jan. 2022).
  12. Commonwealth Fund analysis of the 2021 OECD Social Protection and Well-Being Data, Family Database.
  13. Jacob C. Warren and K. Bryant Smalley, “The Long-Term Impact of COVID-19 on Mental Health,” To the Point (blog), Commonwealth Fund, Dec. 2, 2020.
  14. Centers for Disease Control and Prevention, “Causes of Obesity,” CDC, last updated Mar. 21, 2022.
  15. Zhen-Qiang Ma and Lisa C. Richardson, “Cancer Screening Prevalence and Associated Factors Among U.S. Adults” (editorial), Preventing Chronic Disease 19, no. 220063 (Apr. 21, 2022).
  16. Irene Papanicolas, Liana R. Woskie, and Ashish K. Jha, “Health Care Spending in the United States and Other High-Income Countries,” JAMA 319, no. 10 (Mar. 13, 2018): 1024–39.
  17. Rabah Kamal and Cynthia Cox, “How Do Healthcare Prices and Use in the U.S. Compare to Other Countries?,” Peterson-KFF Health System Tracker, May 8, 2018.
  18. Kamal and Cox, “How Do Healthcare Prices?,” 2018.
  19. Organisation for Economic Co-operation and Development, Health at a Glance 2021: OECD Indicators (OECD Publishing, 2021): 144–46.
  20. Sara R. Collins, Lauren A. Haynes, and Relebohile Masitha, The State of U.S. Health Insurance in 2022: Findings from the Commonwealth Fund Biennial Health Insurance Survey (Commonwealth Fund, Sept. 2022); and Michelle M. Doty et al., “Income-Related Inequality in Affordability and Access to Primary Care in Eleven High-Income Countries,” Health Affairs 40, no. 1 (Jan. 2021): 113–20.
  21. Lovisa Gustafsson and Sara R. Collins, “The Inflation Reduction Act Is a Milestone Achievement in Lowering Americans’ Health Care Costs,” To the Point (blog), Commonwealth Fund, Aug. 15, 2022.
  22. Gerard F. Anderson, Peter Hussey, and Varduhi Petrosyan, “It’s Still the Prices, Stupid: Why the U.S. Spends So Much on Health Care, and a Tribute to Uwe Reinhardt,” Health Affairs 38, no. 1 (Jan. 2019): 87–95.
  23. Molly Fitzgerald, Munira Z. Gunja, and Roosa Tikkanen, Primary Care in High-Income Countries: How the United States Compares (Commonwealth Fund, Mar. 2022).
  24. Organisation for Economic Co-operation and Development, OECD Health Statistics 2022: Definitions, Sources, and Methods (OECD Health, 2022).
  25. Our World in Data, “Coronavirus (COVID-19) Deaths” and “Coronavirus (COVID-19) Vaccinations,” 2023.
  26. Keanan Lane et al., “Tracking the Pandemic’s Effects on Health Outcomes, Costs, and Access to Care,” Health Affairs Forefront (blog), Feb. 2, 2022.
  27. Center for American Progress, “Health Disparities by Race and Ethnicity,” fact sheet, May 7, 2020.

Publication Details

Date

Contact

Munira Z. Gunja, Senior Researcher, International Program in Health Policy and Practice Innovations, The Commonwealth Fund

[email protected]

Citation

Munira Z. Gunja, Evan D. Gumas, and Reginald D. Williams II, U.S. Health Care from a Global Perspective, 2022: Accelerating Spending, Worsening Outcomes (Commonwealth Fund, Jan. 2023). https://doi.org/10.26099/8ejy-yc74