What did health insurance coverage look like for U.S. adults in the first half of 2020 as the country slid into the worst public health and economic crisis in generations? In this brief, we present findings from the Commonwealth Fund’s latest Biennial Health Insurance Survey, which assesses the extent and quality of coverage for U.S. working-age adults. We’ve conducted this survey since 2001. It uses three measures to gauge the adequacy of insurance coverage:
- whether or not people have insurance
- if they have insurance, whether they experienced a gap in coverage in the prior year
- whether high out-of-pocket costs and deductibles are causing them to be underinsured, despite having continuous coverage throughout the year.
The survey began on January 14, 2020 — just before the outbreak of the coronavirus pandemic in the United States. We interviewed a nationally representative sample of 4,272 adults ages 19 to 64 about their health insurance coverage through June 5. (See “How We Conducted This Study” for more detail.) Despite the severity of the pandemic and the abrupt disruption in economic activity beginning in March, the survey did not find statistically significant changes in coverage from the last time it was conducted in 2018. But it does show a persistent vulnerability among working-age adults in their ability to afford coverage and health care that could worsen if the economic downturn continues.
This publication is one in our series on
Previous in the series

Survey Highlights
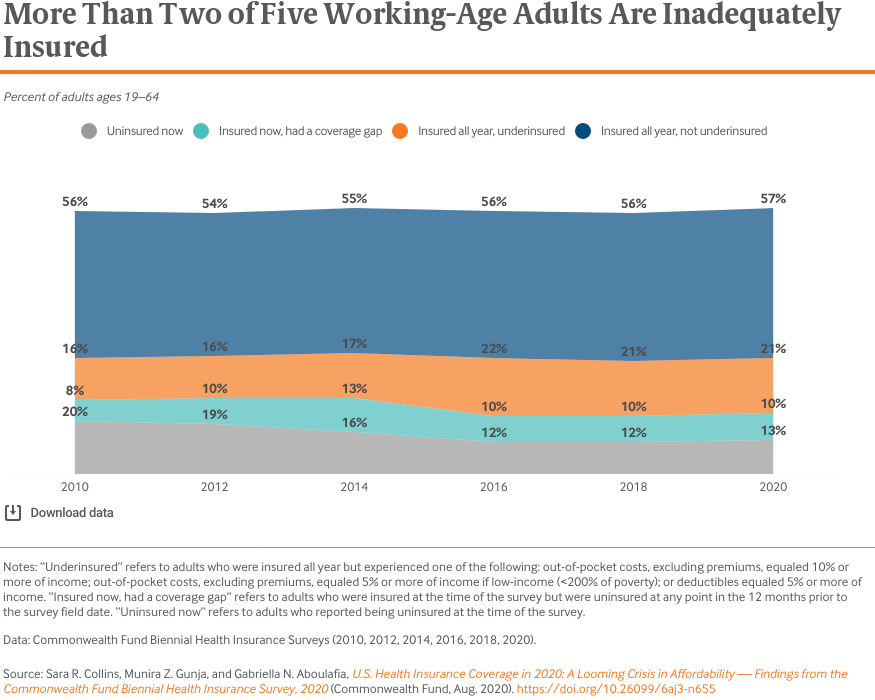
- In the first half of 2020, 43.4 percent of U.S. adults ages 19 to 64 were inadequately insured. This is statistically unchanged from the last time we fielded the survey in 2018.
- The adult uninsured rate was 12.5 percent. In addition, 9.5 percent of adults were insured but had a gap in coverage in the past year and 21.3 percent were underinsured. These findings are also statistically unchanged from 2018.
- There was no statistically significant change in coverage inadequacy between the months leading up to the pandemic and the months that followed, but this may change as the pandemic continues.
- Half of adults who spent any time uninsured or who were underinsured reported problems paying medical bills or said they were paying off medical debt over time. A quarter of those who were continuously insured and did not meet the threshold for underinsurance also reported problems paying bills.
- People who reported problems paying medical bills experienced lingering financial problems including damage to their credit ratings and depleted savings.
Who Is Underinsured?
In this analysis, we use a measure of underinsurance that accounts for an insured adult’s reported out-of-pocket costs over the course of a year, not including insurance premiums, as well as their plan deductible. These actual expenditures and the potential risk of expenditures, as represented by the deductible, are then compared with household income. Specifically, we consider people who are insured all year to be underinsured if:
- their out-of-pocket costs, excluding premiums, over the prior 12 months are equal to 10 percent or more of household income; or
- their out-of-pocket costs, excluding premiums, over the prior 12 months are equal to 5 percent or more of household income for individuals living under 200 percent of the federal poverty level ($25,520 for an individual or $52,400 for a family of four in 2020); or
- their deductible constitutes 5 percent or more of household income.
The out-of-pocket cost component of the measure is only triggered if a person uses their plan to obtain health care; it does not provide information about the plan design. This is why we include a deductible component since it is an indicator of the financial protection the plan offers and the risk of incurring costs before someone gets health care. The definition does not include people who are at risk of incurring high costs because of other aspects of their plan’s design, such as copayments or uncovered services.
In the first half of 2020, 43.4 percent of adults were inadequately insured. This group is made up of people who were uninsured at the time of the survey (12.5%), were insured but had experienced a coverage gap in the past year (9.5%), or were insured continuously but had such high out-of-pocket costs or deductibles relative to their income that they were effectively underinsured (21.3%).1 (See box above.)
Despite the pandemic, we find no statistically significant change in any of our measures of coverage adequacy from 2018. We also did not find significant changes in coverage adequacy between the months leading up to the pandemic and the months that followed, but this may change as the pandemic continues.
The uninsured rate we found falls into the range of estimates of recent federal surveys conducted in 2018 and 2019 (11.7% and 13.7%, respectively.) (See “Estimates of U.S Uninsured Rates” for detail.) It is important to note that our estimated uninsured rate has a margin of sampling error of +/– 1.3 percent and therefore, the true estimate is likely between 11.2 percent and 13.9 percent.2
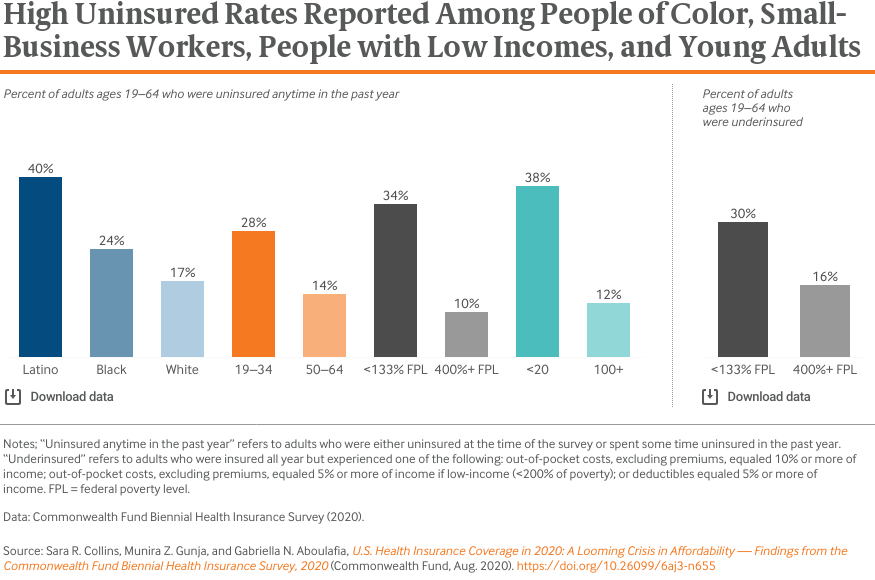
More than one-third of Latino adults, workers in small businesses (i.e., fewer than 20 employees), and adults with low incomes were either uninsured at the time of the survey or spent some time uninsured in the past year (Table 1). This was two or more times higher than comparison groups. Young adults also reported high rates of being uninsured. People with incomes below 133 percent of the federal poverty level (i.e., $16,971 for an individual and $34,846 for a family of four in 2020) reported uninsured rates that were three times higher than adults with incomes at 400 percent of the poverty level or higher (i.e., $51,040 for an individual and $104,800 for a family of four). They also had underinsured rates that were two times as high as their higher-income counterparts.
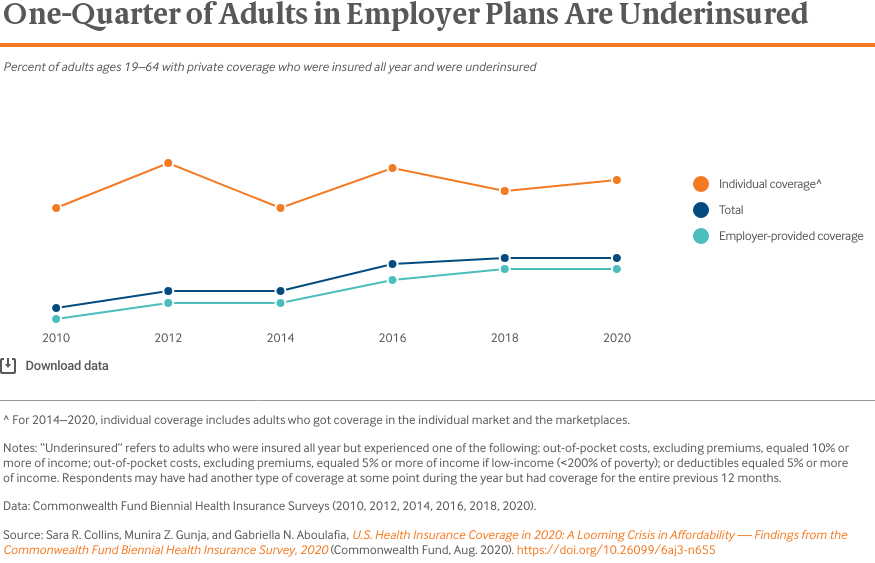
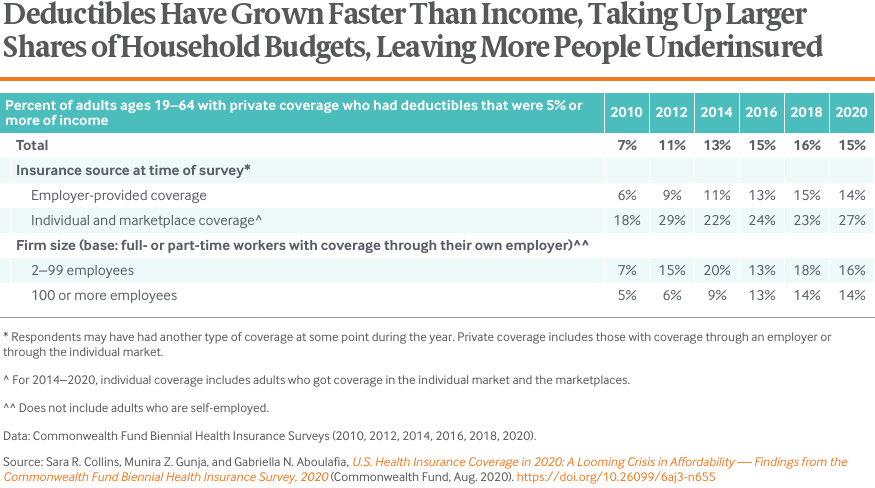
Among people who were insured all year in private health plans, people who were enrolled in plans they bought on their own in the individual market — either directly from an insurer or the Affordable Care Act (ACA) marketplaces — were underinsured at the highest rates. But one-quarter of adults in employer plans also were underinsured. Because there were an estimated 122 million working-age people in employer plans, compared to just 15 million in the individual market, there were far more underinsured people with employer coverage than with individual market insurance.3 The growth in the underinsured since 2010 has been driven by increasingly inadequate coverage in employer health plans.
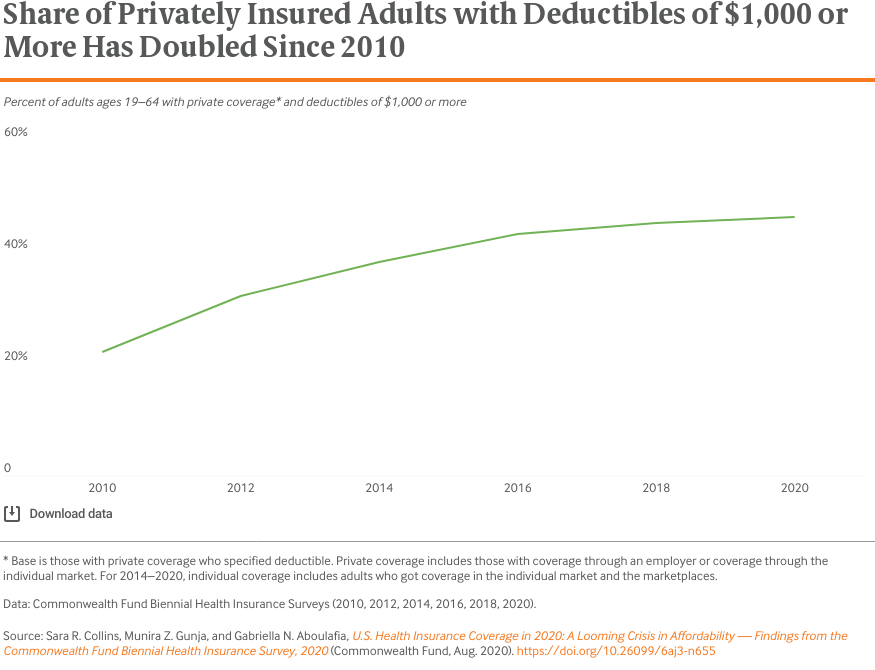
The Commonwealth Fund’s measure of underinsurance includes how much people spent out of pocket in the past year and the size of their deductible, both calculated as a share of their income. Over the past decade, deductibles have grown both in prevalence and size. The share of the adult population in private health plans with deductibles of $1,000 or more doubled between 2010 and 2020.
In 2010, only 7 percent of people in private plans had deductibles that amounted to 5 percent or more of income. By 2016, that share was 15 percent. Because of the dominance of employer coverage in U.S. health insurance, this overall rate has closely tracked that of people enrolled in employer plans.
People who get coverage in the individual market and ACA marketplaces face higher deductibles, on average, relative to their incomes, than people in employer plans. Those with incomes under 250 percent of poverty ($31,900 for an individual and $65,500 for a family of four in 2020) are eligible for marketplace plans with reduced cost-sharing, including lower deductibles. But people with incomes over that threshold see higher deductibles, which ranged as high as $8,150 for silver-level plans in the 38 states where the federal government operated the marketplaces in the 2020 plan year.4
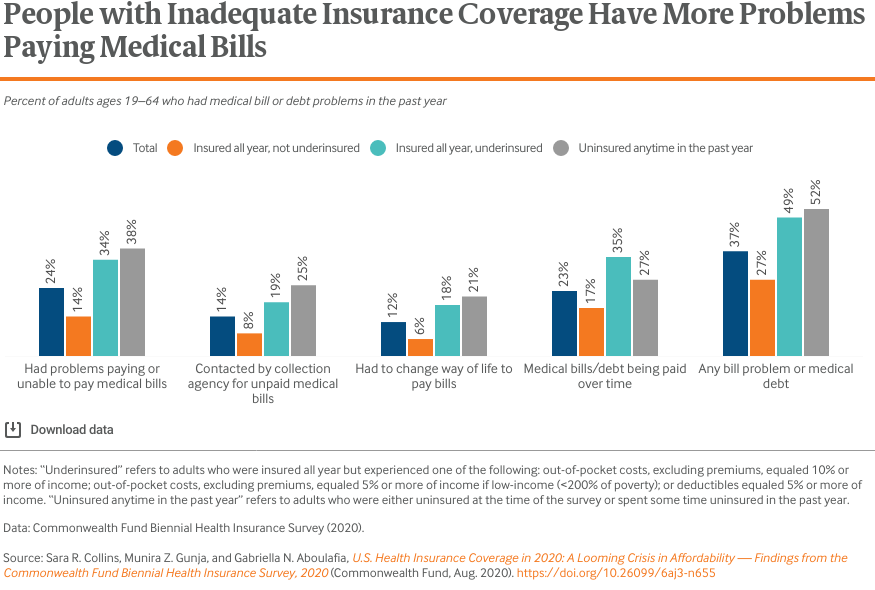
Inadequate insurance coverage leaves people exposed to high health care costs; these expenses can quickly turn into medical debt. Half of adults who spent any time uninsured and those who were underinsured reported problems paying medical bills or said they were paying off medical debt over time. But rates also were high among people with coverage all year who were not underinsured: one-quarter reported medical bill problems or debt. Even though their income combined with their insurance deductible and out-of-pocket spending didn’t meet the threshold for underinsurance, they still struggled with medical bills. The majority of people in this group had employer coverage (data not shown).
The majority (67%) of adults who reported medical bill or debt problems said the person in their household who incurred the medical bill was insured when the care was provided (Table 5). Among those paying off debt over time, more than half (54%) had incurred debt of $2,000 or more.
Among demographic groups, Blacks were significantly more likely than whites to report problems with medical bills (45% vs. 35%), as were lower-income people (133% of poverty or lower) compared to people with higher incomes (400% of poverty or higher) (42% vs. 27%) (data not shown).
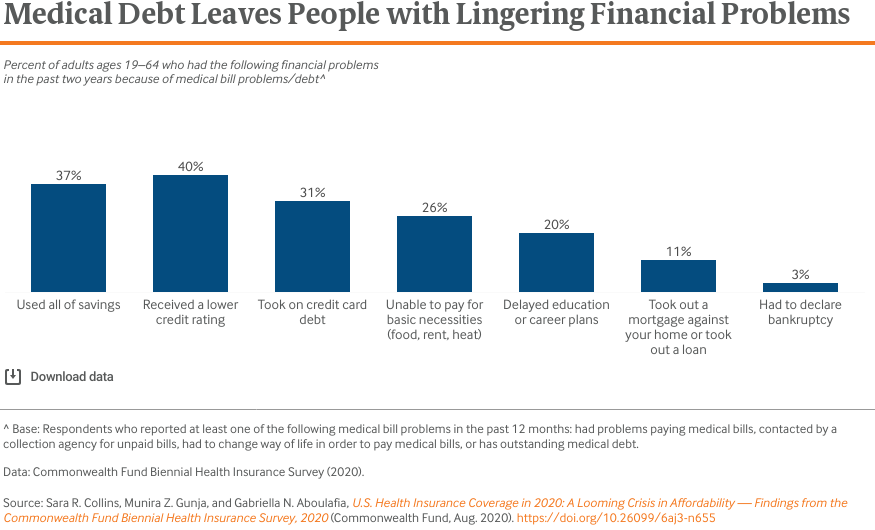
Paying off accumulated medical debt over time can have a major impact on people’s lives. Many adults with medical bill or debt problems reported serious financial problems. Among those who reported any medical bill or debt problem, 37 percent said they had used up all their savings to pay their bills, 40 percent had received a lower credit rating as a result of their medical debt, 31 percent racked up debt on their credit cards, and one-quarter were unable to pay for basic necessities such as food, heat, or rent. People who were underinsured were particularly affected: nearly half (48%) said they had used up all their savings to pay off their bills (Table 5).
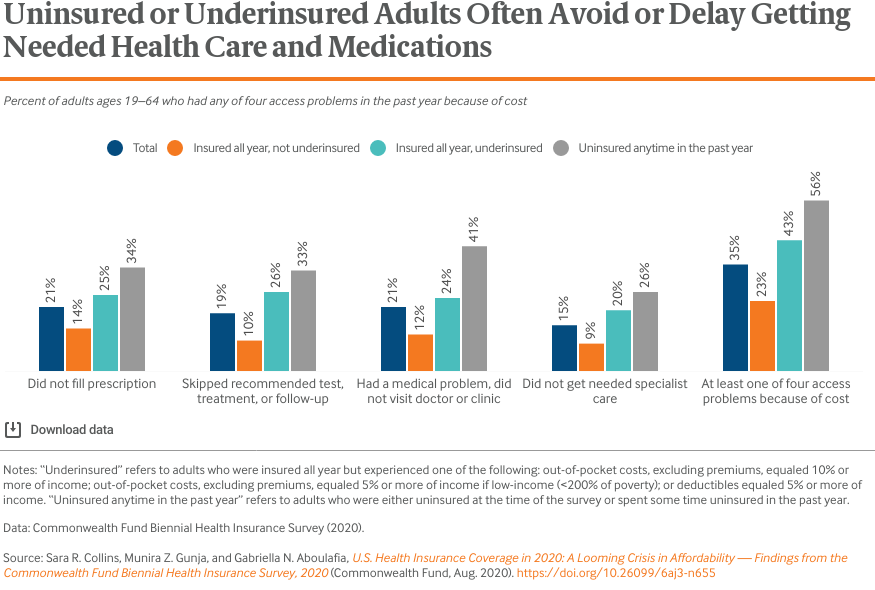
While insurance status is not the only determinant of whether a person has access to health care, it is the most important.5 Research has concluded that the ACA’s coverage expansions led to significant improvements in access over the past 10 years.6 But financial barriers to care remain in the U.S. because millions of people either lack insurance or have coverage with significant cost-sharing. More than one-third (35%) of all adults reported at least one cost-related problem getting needed health care in the past year including not filling a prescription; skipping a recommended test, treatment or follow-up visit; not going to a doctor when sick; or not getting needed specialist care. Rates were highest among adults who spent any time uninsured during the year (56%) and those who were underinsured (43%). But even adults who were insured all year and not underinsured had access issues: 23 percent reported at least one cost-related problem getting health care. Most of this group had employer coverage (data not shown).
Cost-related problems getting needed care were higher among people with incomes below 133 percent of poverty compared to those with incomes of 400 percent of poverty or more (42% vs. 25%), and also among workers in small businesses of less than 20 employees compared to those in companies with 100 or more employees (42% vs. 31%) (data not shown).
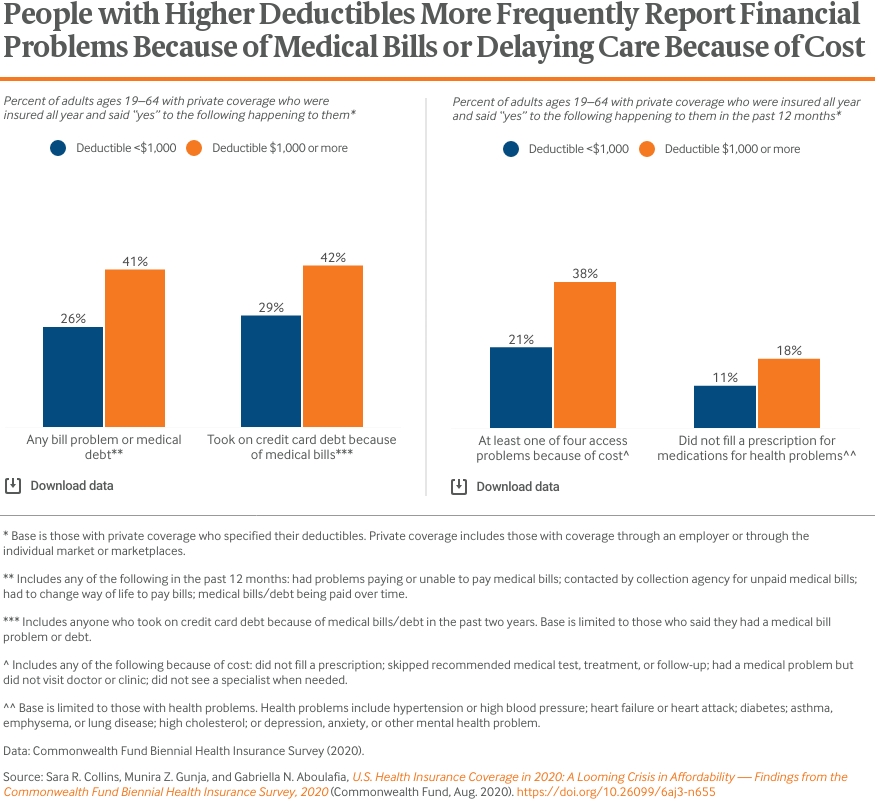
The survey indicates that deductibles alone are associated with financial problems and may impact people’s decisions about whether to get needed health care. People in private health plans who were insured all year with deductibles of $1,000 or more were significantly more likely than those with lower or no deductibles to report problems paying medical bills or said they were paying off medical debt over time. Of this group, only half (53%) met the definition of underinsured (data not shown). People with higher deductibles also were carrying higher debt loads: 62 percent of people with deductibles of $1,000 or more who said they were paying off medical debt had incurred debt of $2,000 or more compared to 46 percent of those with lower deductibles who owed payments for bills (Table 5).
Higher deductibles can lead people to decide against getting needed care even if they have health problems. People with at least one health problem who were enrolled in higher-deductible plans were more likely to report that they had not filled a prescription or had skipped a dose of medication for their health problem than people with lower or no deductibles.
The ACA dramatically reformed the individual insurance market by banning insurers from denying coverage, charging higher premiums, or excluding preexisting conditions for people with health problems. In addition, it provided subsidies to offset the cost of premiums for people with incomes under 400 percent of poverty and deductibles and other cost-sharing for those under 250 percent of poverty. Given the loss of employer coverage and declining incomes among millions of people because of the COVID-19 pandemic, the marketplaces, along with Medicaid, could become more important than ever in insuring Americans.
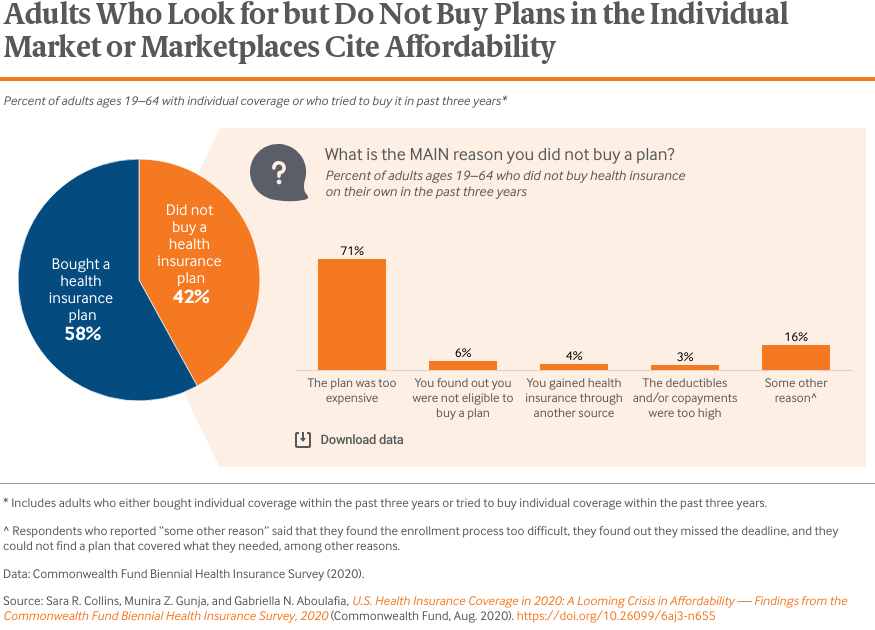
Despite the ACA reforms, survey data has consistently indicated that affordability remains a widespread challenge for many people enrolled in the individual market and the marketplaces or for those who want to enroll.7 This year, we asked people who had purchased or tried to buy a plan in the individual market or the marketplaces in the past three years about their experience. Nearly 60 percent of those who tried to buy a plan ultimately enrolled. When we asked why people did not buy a plan, 71 percent cited cost as the main reason.
Conclusion and Policy Implications
The United States entered the pandemic with 30 million uninsured people and more than 40 million underinsured. These numbers are certain to climb this year. The Congressional Budget Office projects that the U.S. economy will contract by more than 5 percent in 2020 and 25 million fewer people will be working in the third quarter of 2020 compared to the end of 2019.8 The Urban Institute estimates that this employment disruption will leave 3.5 million more people uninsured by the end of the year.9 And millions more will suffer income loss through furloughs, wage cuts, and declining business revenue. Unless there is a significant drop in premiums and deductibles in private coverage, many households will face health care costs that take up a growing share of shrinking budgets.
Coverage insecurity will leave people with mounting medical debt, as well as significant financial barriers to getting the health care they need to survive the pandemic and lead healthy and productive lives. Several policy options at the federal and state levels could move the nation toward universal, comprehensive coverage and provide relief to U.S. families. These include:
- expanding Medicaid in the 12 states that have yet to do so or providing a federal fallback option for people eligible in those states
- enhancing and extending the ACA marketplace subsidies both for premiums and cost-sharing
- allowing more people with unaffordable employer plans to purchase subsidized coverage through the marketplaces, possibly through a public plan
- increasing outreach and enrollment efforts to inform people of their coverage options, particularly those who lose employer coverage
- banning non-ACA-compliant plans like short-term policies that leave people exposed to catastrophic health care costs
- developing an autoenrollment mechanism that will enable people to enroll and stay enrolled in comprehensive coverage.
There are other paths to universal coverage and improved affordability, like a single payer or “Medicare for All” approach.10 The reforms outlined here don’t preclude such a path but could be a practical first step toward a more regulated insurance system that includes more public financing. But ongoing policy inaction on insurance coverage combined with the raging pandemic is certain to tip the nation’s health care affordability problems into crisis for U.S. households.
How We Conducted This Study
The Commonwealth Fund Biennial Health Insurance Survey, 2020, was conducted by SSRS from January 14 through June 5, 2020. The survey consisted of telephone interviews in English and Spanish and was conducted among a random, nationally representative sample of 4,272 adults ages 19 to 64 living in the continental United States. A combination of landline and cellular phone random-digit dial (RDD) samples was used to reach people. In all, 400 interviews were conducted with respondents on landline telephones and 3,872 interviews were conducted on cellular phones.
The sample was designed to generalize to the U.S. adult population and to allow separate analyses of responses from low-income households. Statistical results are weighted to correct for the stratified sample design, the overlapping landline and cellular phone sample frames, and disproportionate nonresponse that might bias results. The data are weighted to the U.S. adult population by age, sex, race/ethnicity, education, household size, geographic region, population density, and household telephone use, using the U.S. Census Bureau’s 2019 Current Population Survey.
The resulting weighted sample is representative of the approximately 193.5 million U.S. adults ages 19 to 64. The survey has an overall maximum margin of sampling error of +/– 2.0 percentage points at the 95 percent confidence level. As estimates get further from 50 percent, the margin of sampling error decreases. The RDD landline portion of the survey achieved a 7.7 percent response rate and the RDD cellular phone component achieved a 6.5 percent response rate.
We also report estimates from the 2010, 2012, 2014, 2016, and 2018 Commonwealth Fund Biennial Health Insurance Surveys. The surveys through 2016 were conducted by Princeton Survey Research Associates International using the same stratified sampling strategy that was used in 2018 and 2020 by SSRS.
=In 2010, the survey was conducted from July 14 to November 30, 2010, among 3,033 adults ages 19 to 64; in 2012, the survey was conducted from April 26 to August 19, 2012, among 3,393 adults ages 19 to 64; in 2014, the survey was conducted from July 22 to December 14, 2014, among 4,251 adults ages 19 to 64; in 2016, the survey was conducted from July 12 to November 20, 2016, among 4,186 adults ages 19 to 64; and in 2018, the survey was conducted from June 27 to November 11, among 4,225 adults ages 19 to 64.
Estimates of U.S. Uninsured Rates
Survey
|
Current uninsured rate
[confidence interval]
|
Population
|
Time frame
|
Sample frame
|
|
Commonwealth Fund Biennial Health Insurance Survey11
|
12.5%
[11.2%, 13.9%]
|
U.S. adults ages 19–64
|
January–June 2020
|
Dual-frame, RDD telephone survey
|
|
National Health Interview Survey (NHIS) (Jan.–June 2019)12
|
13.7%
[12.9%, 14.6%]
|
U.S. adults ages 18–64
|
January–June 2019
|
Multistage area probability design; personal household interviews13
|
|
Current Population Survey (CPS) (2019)14
|
11.7%
[11.4%, 12.0%]
|
U.S. adults ages 19–64
|
January–December 2018
|
Probability-selected sample; personal and telephone interviews15
|
Revision to the 2018 Underinsured Estimate
In the 2018 Biennial Survey, two nonresponse categories in a question used to gather income information (those earning more than $35,000) were recoded during questionnaire development without a corresponding adjustment to the created variable that underlies the underinsured measure. This error had an impact on our 2018 estimate and was discovered this year in our analysis of trend data on this measure. We are therefore revising the 2018 estimate as part of the release of this year’s survey.
The consequences of this error in 2018 are below. The revised 2018 estimates are not statistically different from the reported estimates.
> Underinsured estimates, rates, full population of 19-to-64-year-old adults
- The 2018 estimate was 22.6% [21.0, 24.2]
- The corrected 2018 estimate is 21.3% [19.8, 22.9]
- The 2020 estimate is 21.3% [19.7, 23.0]
> Underinsured estimates, millions, full population of 19-to-64-year-old adults
- The 2018 estimate was 43.8 million [40.5, 47.1]
- The corrected 2018 estimate is 41.4 million [38.2, 44.5]
- The 2020 estimate is 41.1 million [37.8, 44.5]
> Underinsured estimates, rates, 19-to-64-year-old adults insured all year with private insurance
- The 2018 estimate was 29.7 percent [27.3, 32.2]
- The corrected 2018 estimate is 27.5 percent [25.2, 30.0]
- The 2020 estimate is 27.6 percent [25.2, 30.1]
Acknowledgments
The authors thank Robyn Rapoport, Rob Manley, and Jazmyne Sutton of SSRS, and David Blumenthal, Liz Fowler, Michelle Doty, Jesse Baumgartner, Barry Scholl, Chris Hollander, Deborah Lorber, Jen Wilson, and Paul Frame, all of the Commonwealth Fund.