A new report, which describes visit trends through the end of 2020, is available here.
The Impact of the COVID-19 Pandemic on Outpatient Visits: Changing Patterns of Care in the Newest COVID-19 Hot Spots
-
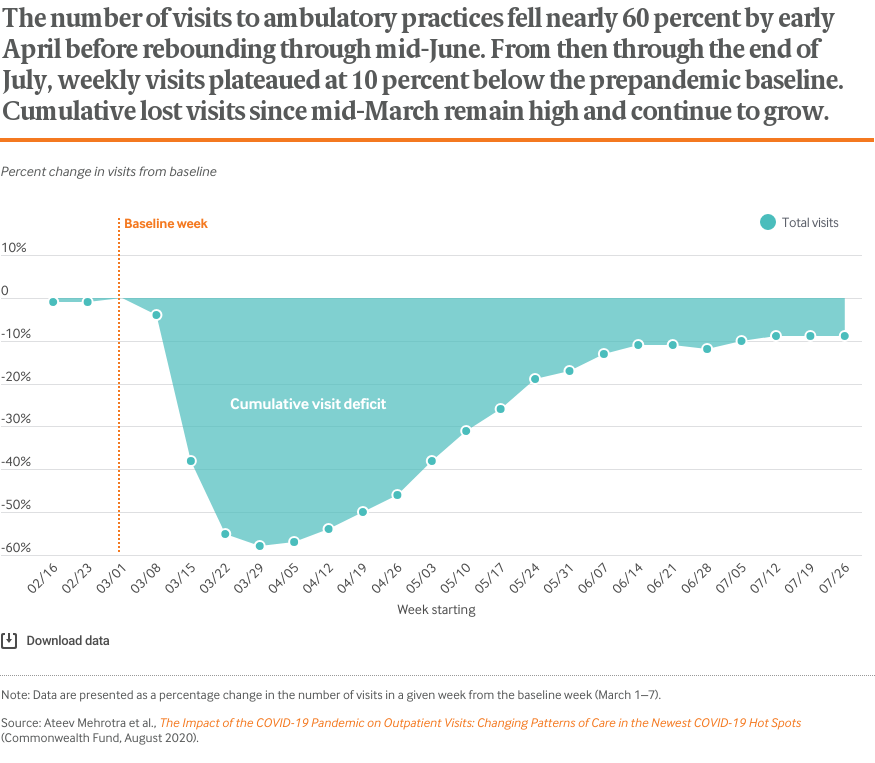
Visits to physician offices and other health care practices, which had fallen 60 percent by early April, have now rebounded and plateaued at 10 percent below prepandemic levels
-
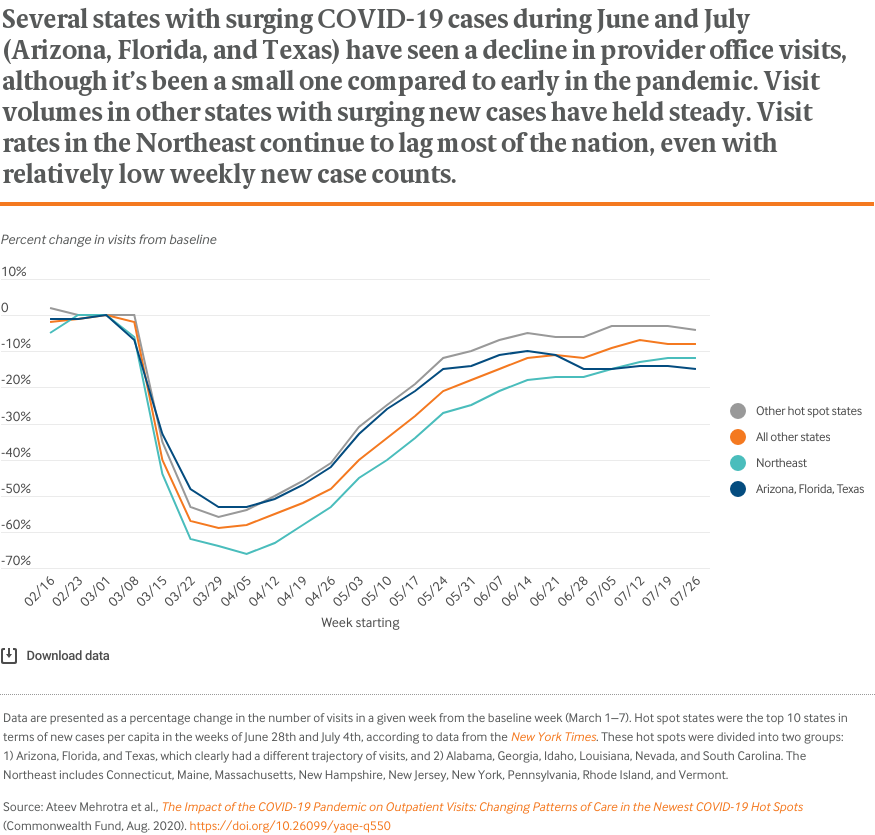
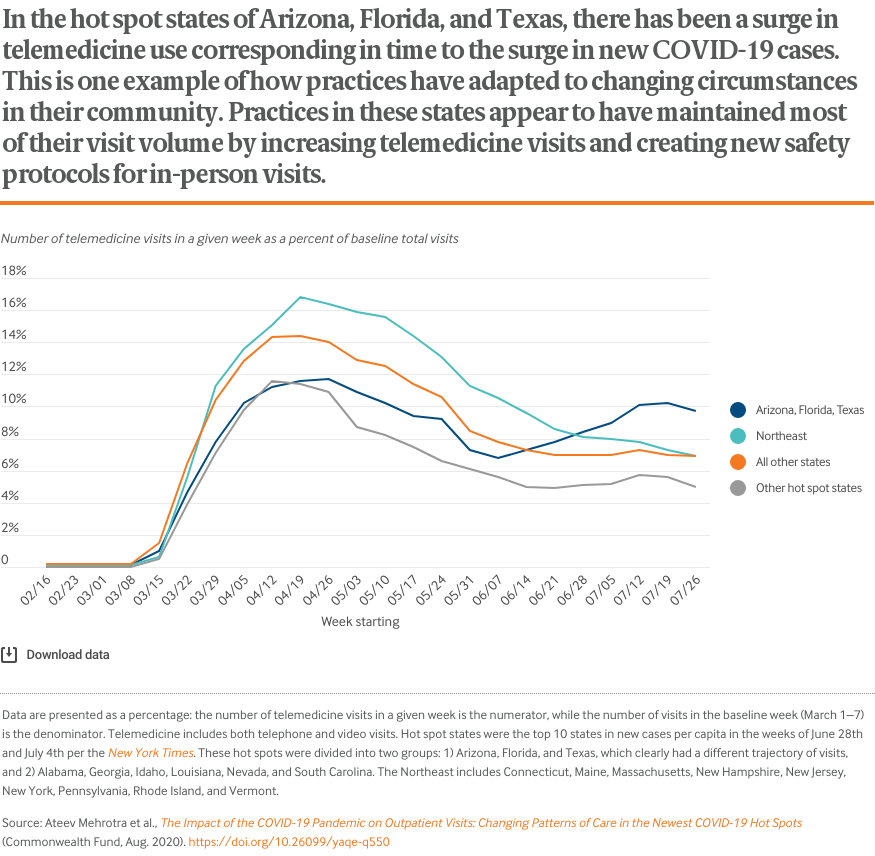
In the newest COVID-19 hot spots, there has been an increase in telemedicine visits and a modest decrease in total visits
-
Visits to physician offices and other health care practices, which had fallen 60 percent by early April, have now rebounded and plateaued at 10 percent below prepandemic levels
-
In the newest COVID-19 hot spots, there has been an increase in telemedicine visits and a modest decrease in total visits
The COVID-19 pandemic has brought dramatic changes to the delivery of outpatient care. To decrease the risk of transmitting the novel coronavirus to patients or health care workers, health care practices have deferred elective visits, modified their practices to safely accommodate in-person visits, and increased their use of telemedicine.
In late April, we published findings demonstrating that, early in the pandemic, the number of visits to ambulatory care practices had declined by nearly 60 percent. We issued an update in mid-May showing a substantial rebound in office visits and an update in late June showing the beginning of a plateau in this rebound. In this, our fourth report, we describe visit trends through August 1.
During late May and much of June, local and state officials were lifting many of the restrictions placed on travel and nonessential services. Stores and other businesses began to reopen. By late June, however, several “hot spots” had emerged, with new COVID-19 cases surging in early-opening states like Arizona, Florida, and Texas while other areas of the country, most notably the Northeast, saw declining or low rates of new cases.
In all areas of the United States, outpatient practices and patients face a changing incidence of COVID-19 in their community, shifting local public health recommendations, and the ongoing challenges of revenue shortfalls and keeping patients and providers safe.
By tracking trends in outpatient office visits, we hope to shed light on several persistent questions:
- What is the clinical impact of the pandemic? Are people getting the care they need from their providers?
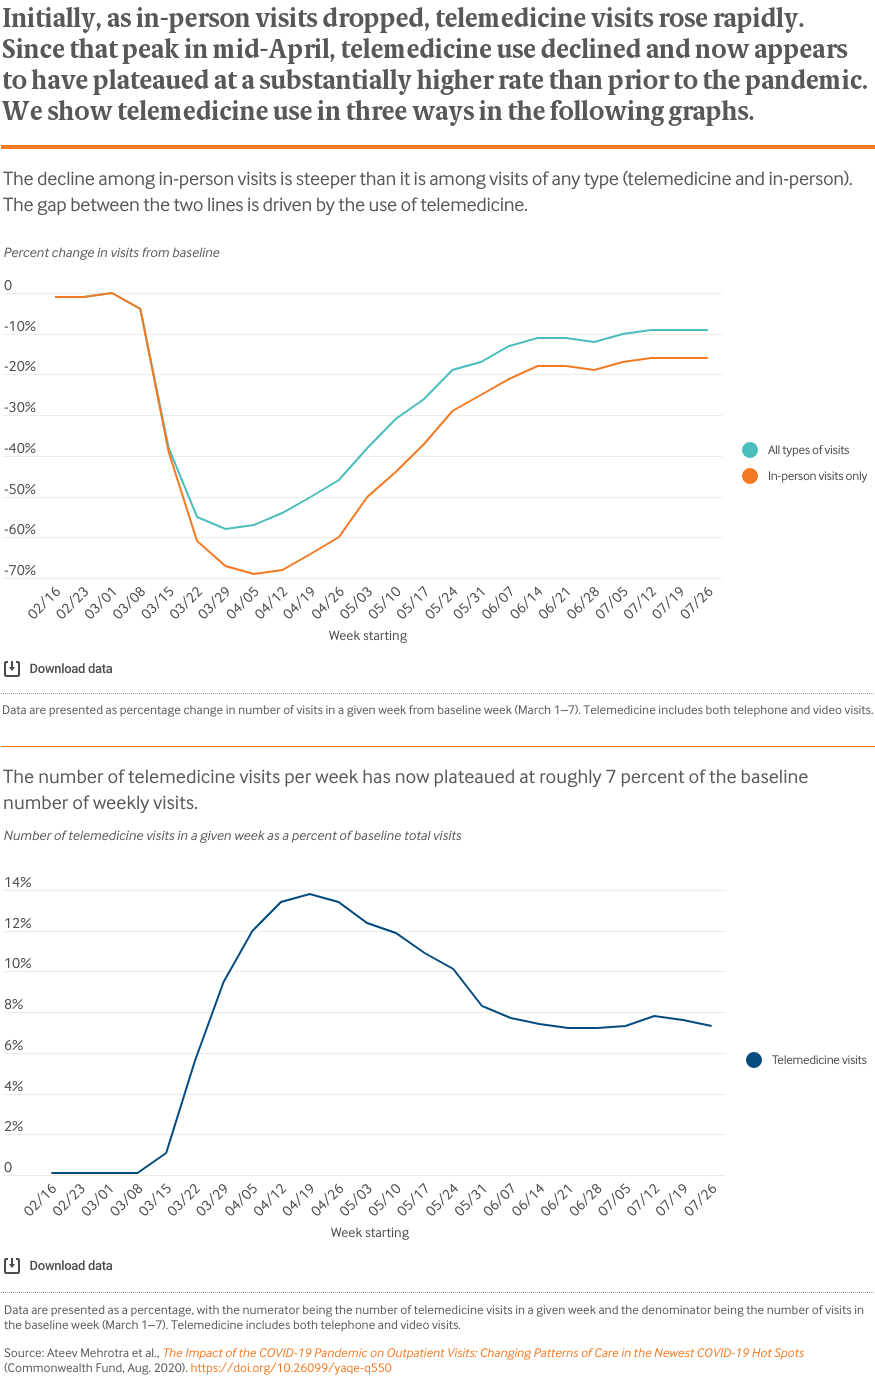
- Are new policies encouraging greater use of telemedicine?
- What is the financial impact of the pandemic on health care practices?
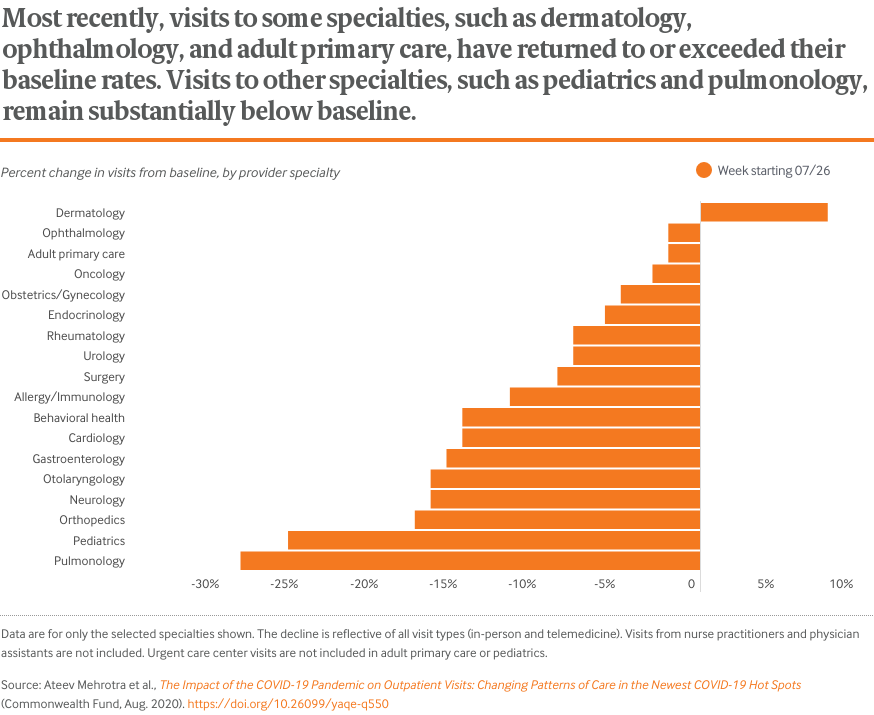
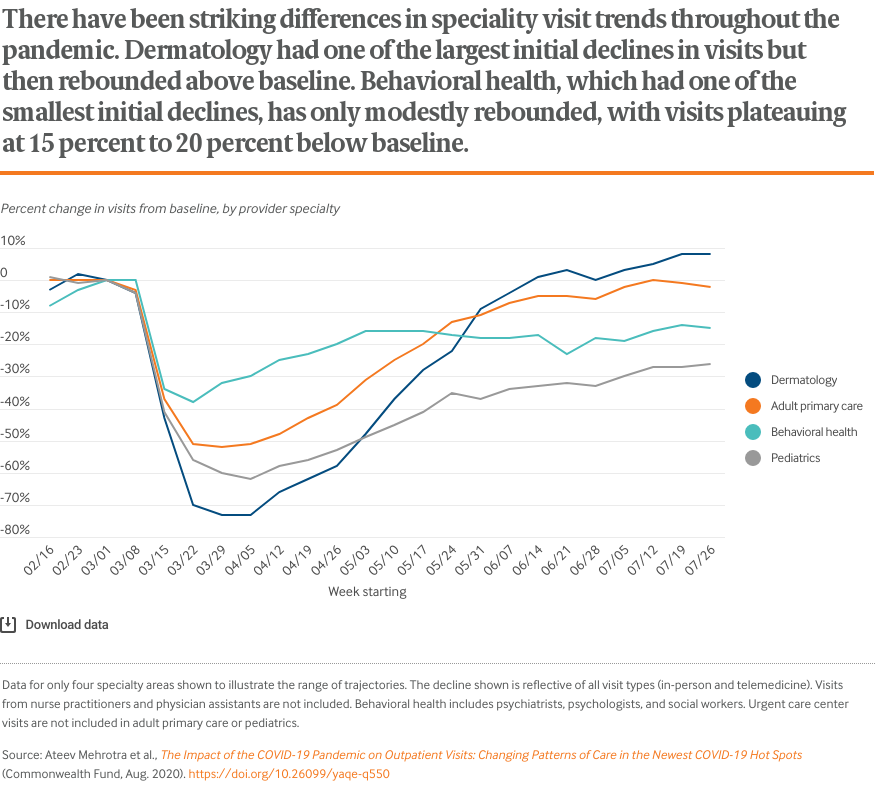
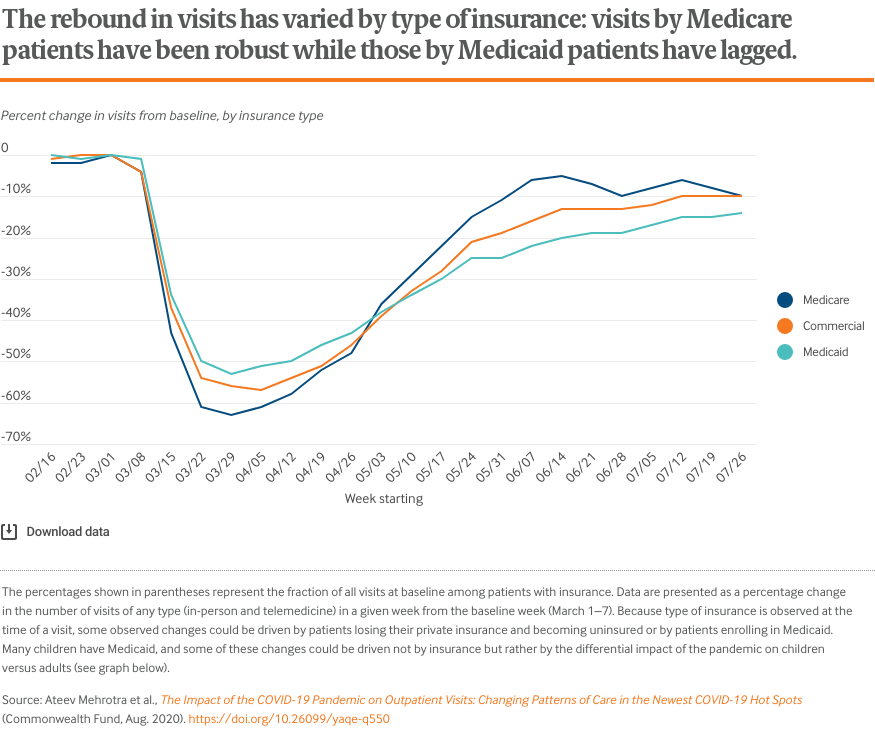
Researchers at Harvard University, Phreesia (a health care technology company), and the Commonwealth Fund analyzed data on changes in visit volume for the more than 50,000 providers that are Phreesia clients. The following charts illustrate how declines in visits vary by patient age, geographic area, clinical specialty, and insurer. Details on data sources, analyses, and study limitations are available at the bottom of this post.
Data and Analyses
Phreesia is a health care technology company that helps ambulatory practices with the patient intake process, including registration, insurance verification, patient questionnaires, patient-reported outcomes, and payments. The data reported here come from Phreesia’s clients, which include more than 1,600 provider organizations representing more than 50,000 providers across all 50 states. In a typical year, these provider organizations have more than 50 million outpatient visits, or more than 1 million visits a week.
The provider organizations include independent single-provider practices, multispecialty groups, Federally Qualified Health Centers, and large health systems. Of all visits in a typical week before the pandemic, 47 percent are with primary care physicians (adult and pediatric) and the other 54 percent of visits are spread across more than 25 specialties. Visits with nurse practitioners and physician assistants are included under these 25 other specialties.
The data come from several sources at the practices: 1) practice management/scheduling software; 2) check-in information submitted via patients on the Phreesia platform (e.g., age); and 3) selected data from the electronic health record, such as problem lists.
Visits were captured from February 1 through August 1, 2020. A visit was counted if it was in the practice’s scheduling software and the patient was “checked in.” A visit is considered checked in when either the patient or someone at the practice (such as a nursing assistant) filled in the necessary information using the Phreesia platform and the patient was ready to see the provider. Telemedicine visits were identified in the scheduling software based on the appointment type or location. Telemedicine includes both telephone and video visits. The data exclude any new Phreesia clients who joined after February 15, 2020.
All data were analyzed by Phreesia staff in consultation with Harvard University researchers. Results were calculated and shared with Harvard researchers in aggregate form as percentage drops from baseline. The baseline for visits was defined as the week of March 1 to 7; a representative week among the practices prior to effects of the pandemic. Visits on holidays (President’s Day, February 17, Good Friday, April 10, Memorial Day, May 25, and the Fourth of July — as well as Friday, July 3) were excluded.
The data have limitations. As with any convenience sample of practices, the patterns we observe may not be representative of all practices nationally or regionally. Unscheduled same-day and walk-in visits are typically captured in the scheduling software, but it is possible some unscheduled telephone encounters may not be captured if they were not recorded in the software. Workflow and documentation practices have likely shifted during the pandemic. In addition, early in the pandemic, providers were still creating processes to designate telemedicine visit types in their scheduling software. As a result, the fraction of all visits identified as telemedicine may be underestimated.
Publication Details
Date
Contact
Ateev Mehrotra, Chair, Department of Health Services, Policy, and Practice, Brown School of Public Health
[email protected]Citation
Ateev Mehrotra et al., The Impact of the COVID-19 Pandemic on Outpatient Visits: Changing Patterns of Care in the Newest COVID-19 Hot Spots (Commonwealth Fund, Aug. 2020). https://doi.org/10.26099/yaqe-q550
Area of Focus