
Advanced Search

Advanced Search

Current Filters

Filter your query

Publication Types

Other

to

Issue Briefs

/

The New Gold Standard: How Changing the Marketplace Coverage Benchmark Could Impact Affordability

High angle view of a row of gold ingot

One proposal to reduce high out-of-pocket costs in plans sold through the Affordable Care Act marketplaces is to change the plan category used as the benchmark for determining the tax credit from silver to gold. Photo: Antonio Gravante/EyeEm/Getty Images

One proposal to reduce high out-of-pocket costs in plans sold through the Affordable Care Act marketplaces is to change the plan category used as the benchmark for determining the tax credit from silver to gold. Photo: Antonio Gravante/EyeEm/Getty Images

Toplines
  • Switching the benchmark plan in the health insurance marketplaces from silver to gold would mean a greater share of people’s out-of-pocket costs would be covered, closer to most employer plans

  • Modest changes to individual health insurance coverage could encourage more people to get the care they need and keep them from incurring medical debt

Abstract

  • Issue: One proposal to reduce high out-of-pocket costs in plans sold through the Affordable Care Act marketplaces is to change the plan category used as the benchmark for determining the tax credit. A switch in the benchmark plan from silver to gold would mean a greater share of enrollees’ health costs would be covered.
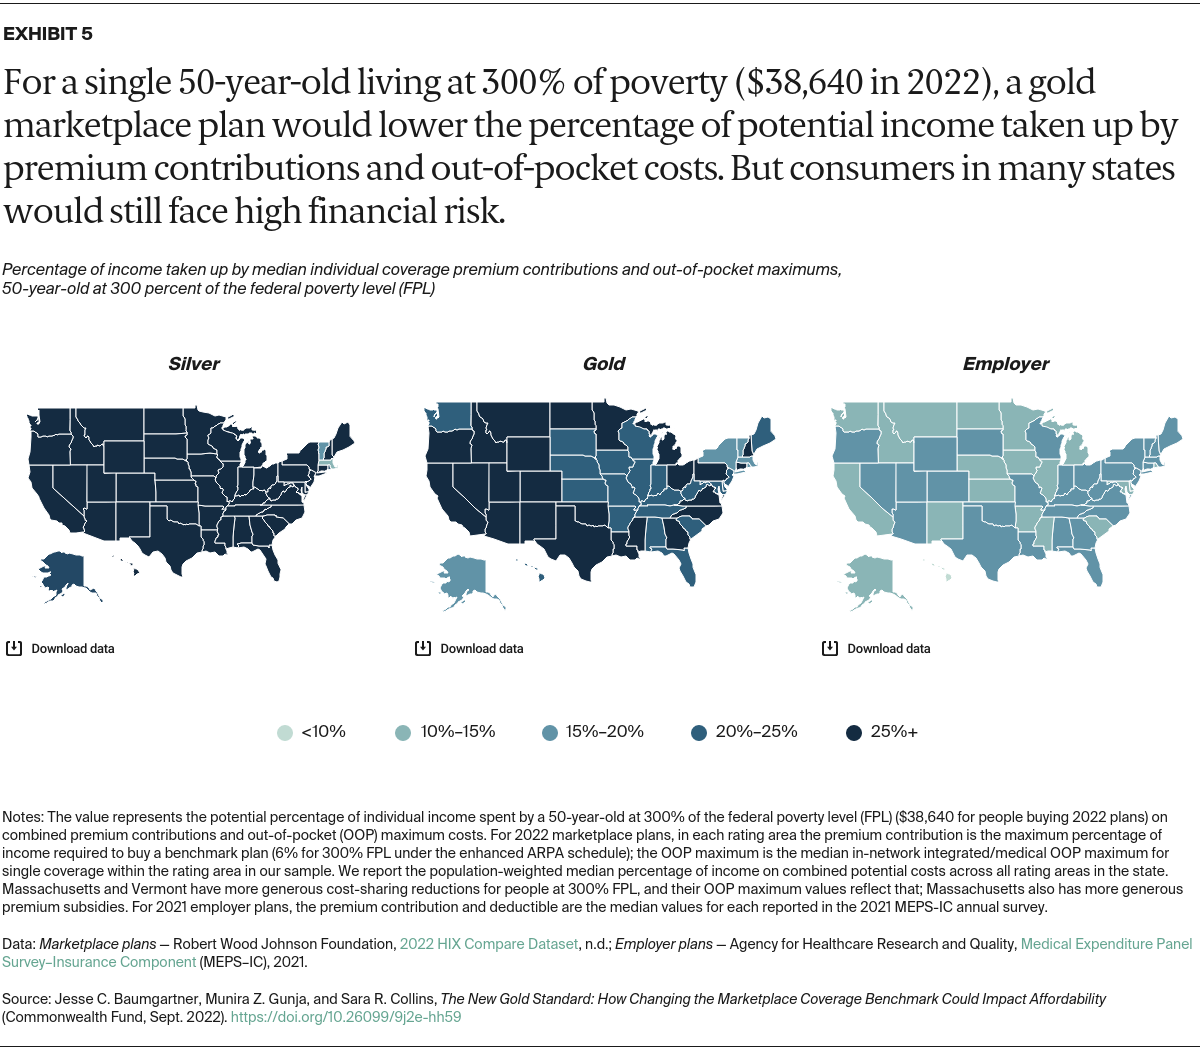
  • Goal: To analyze how changing the benchmark plan to gold would potentially affect deductibles and out-of-pocket limits and to compare new potential costs to those in employer-sponsored plans.
  • Methods: Analysis of the 2022 Robert Wood Johnson Foundation HIX Compare dataset and the 2021 Medical Expenditure Panel Survey–Insurance Component.
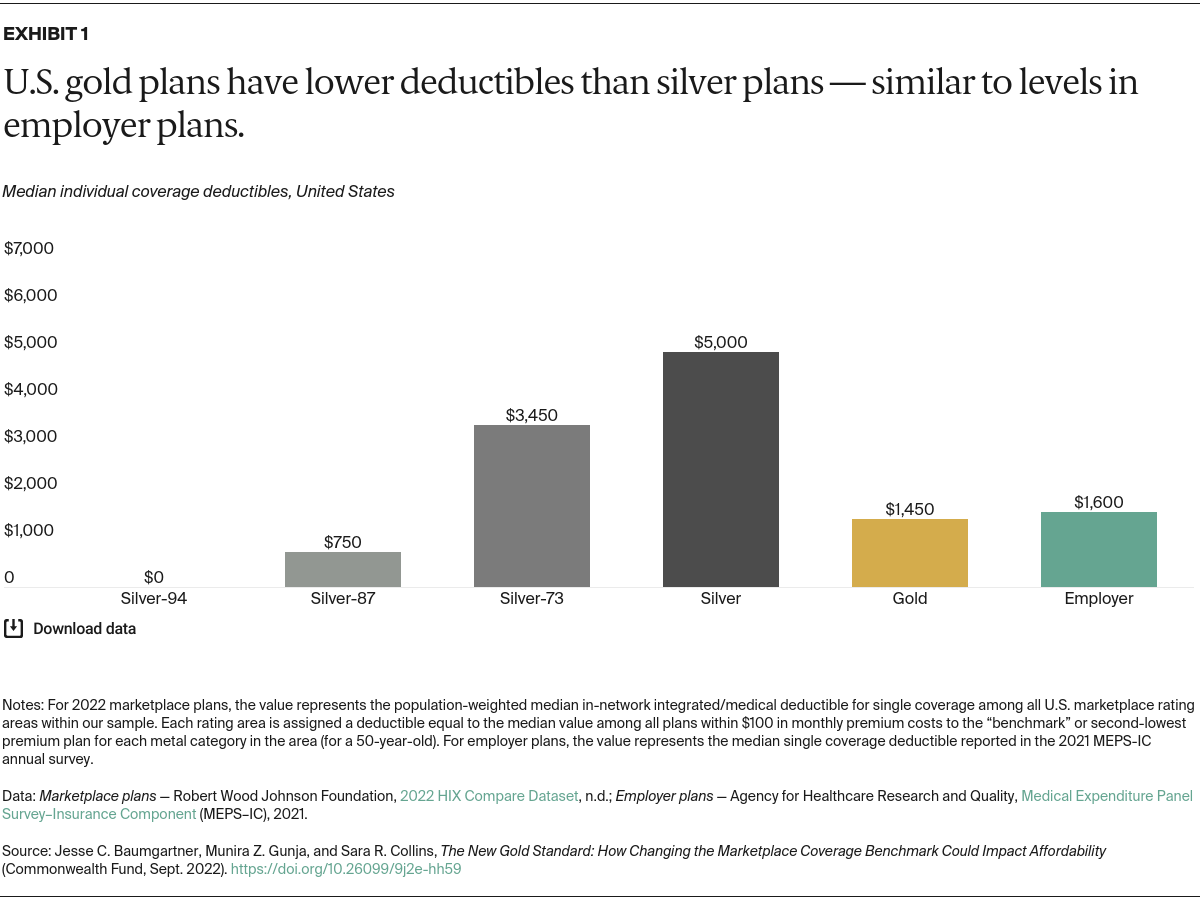
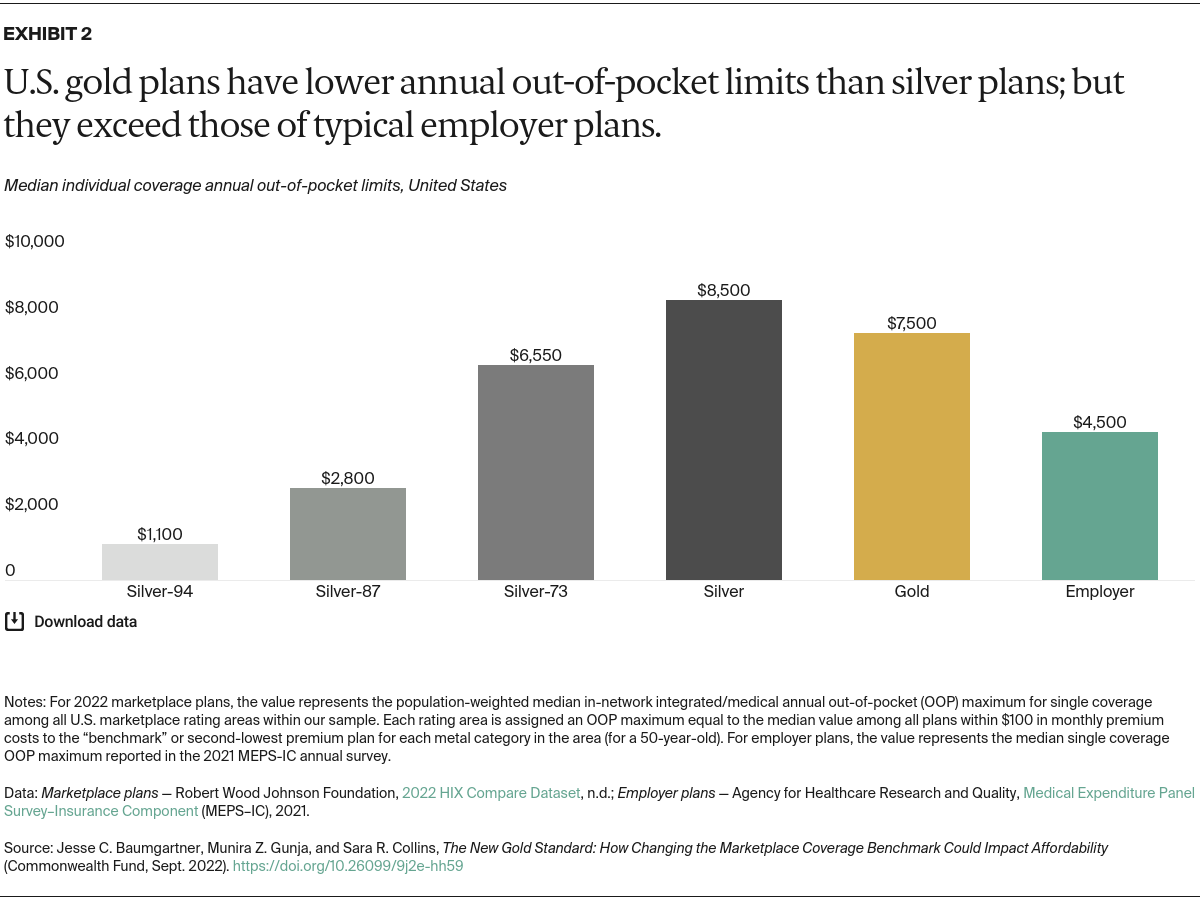
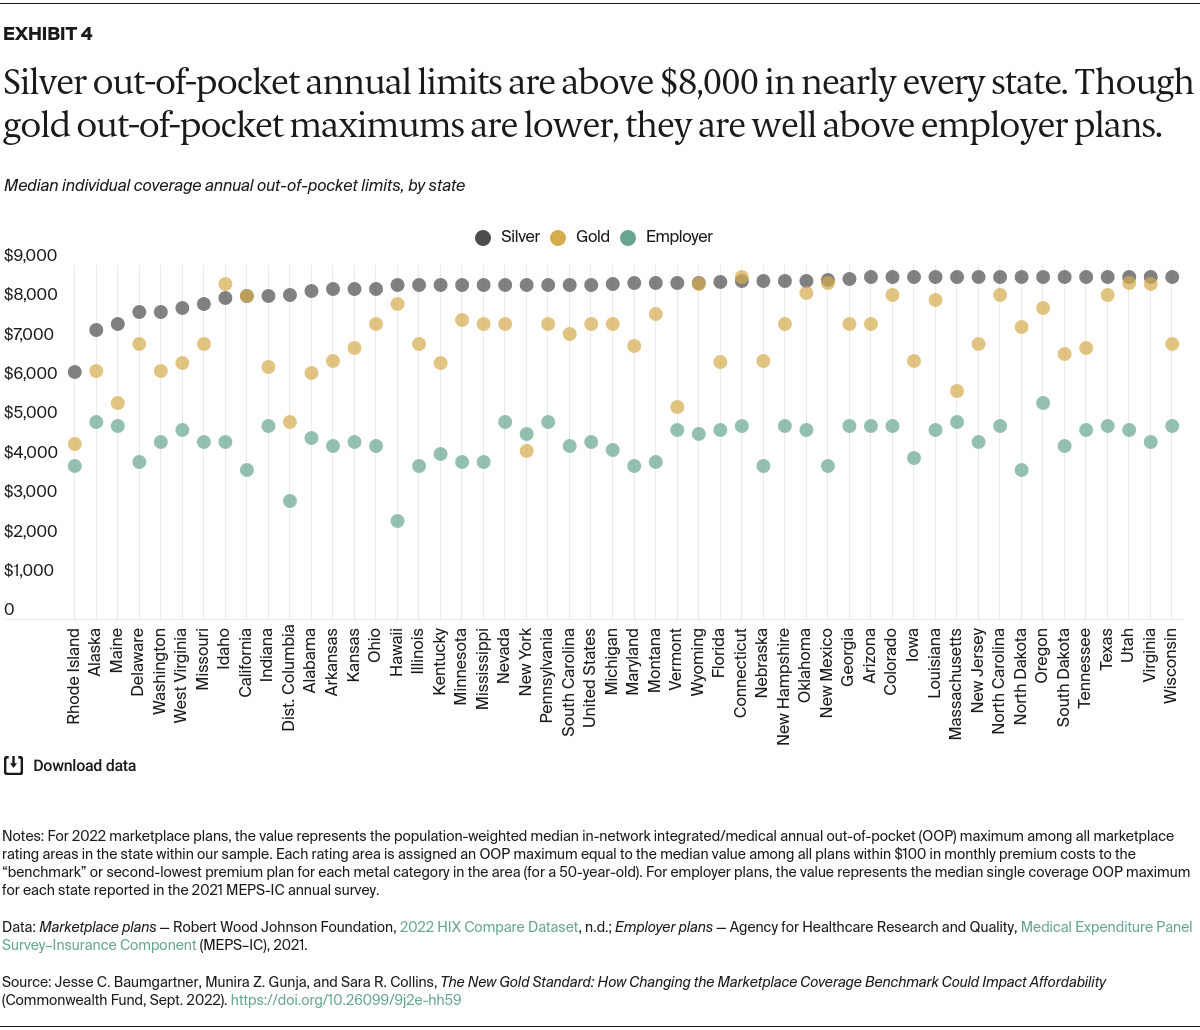
  • Key Findings and Conclusions: Changing the benchmark to gold would lower the national median deductible for individual coverage from $5,000 to $1,450, based on 2022 marketplace data. This latter amount is similar to the median deductible in employer plans. The national median out-of-pocket maximum in lower-cost gold plans, $7,500, is lower than silver plans but still much higher than employer plans. Enabling more consumers to afford a gold plan could ease the burden of high deductibles and reduce out-of-pocket spending for lower- and middle-income households in exchange for a moderate increase in federal spending.

Introduction

The affordability of health care is a pressing concern for many people with commercial health insurance plans, both those obtained through employers and through the Affordable Care Act (ACA) marketplaces. The American Rescue Plan Act (ARPA) temporarily increased subsidies for marketplace plan premiums, making coverage more affordable and helping to drive record plan enrollment during 2021 and 2022.1 The Inflation Reduction Act extended those subsidies through 2025.2

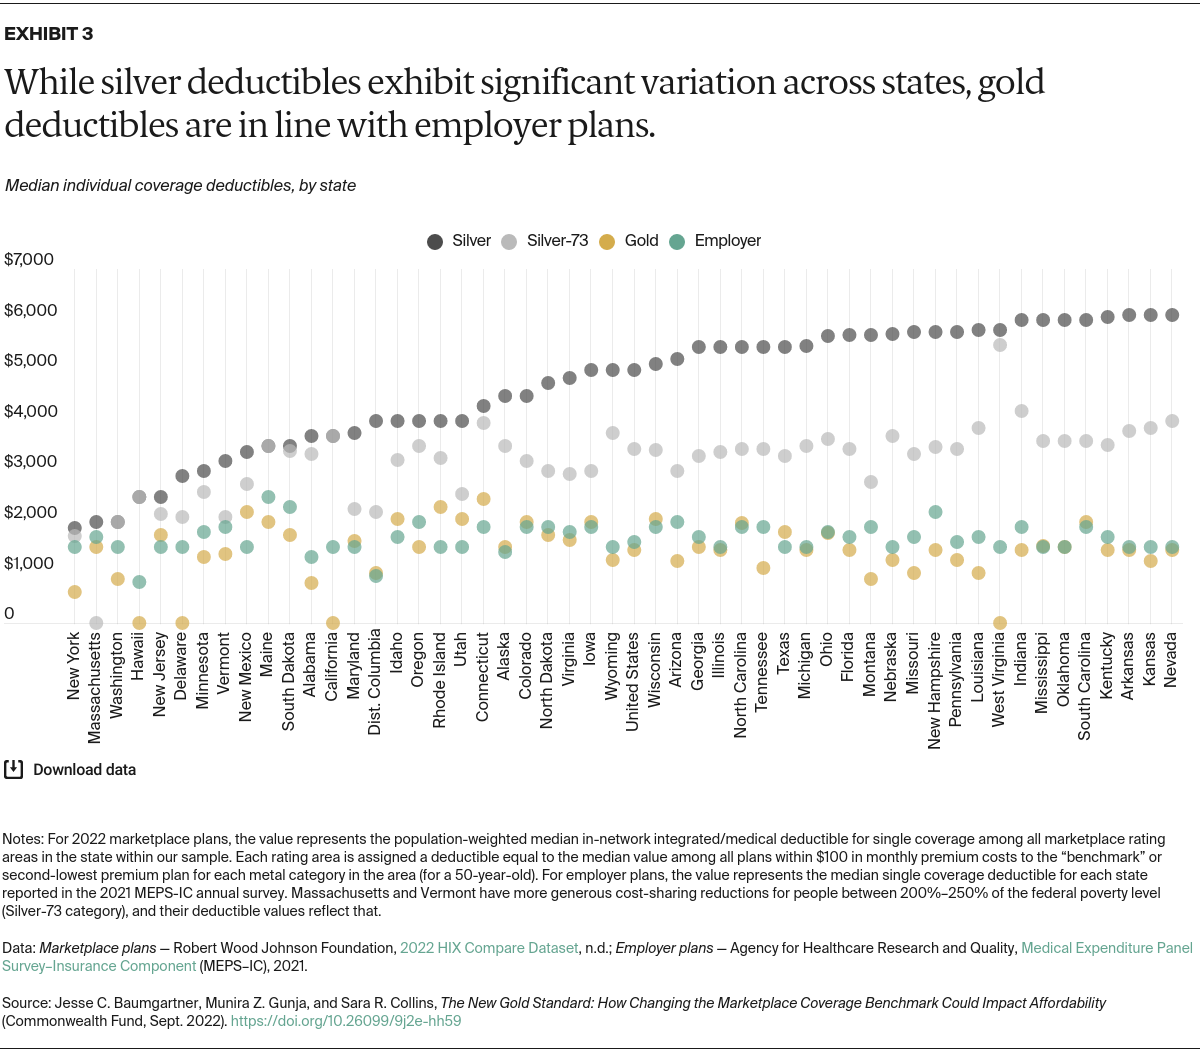
Although premium costs are important, people accessing care also face financial risk from deductibles and other cost-sharing features, like the annual out-of-pocket maximum. Marketplace plans protect people with very low incomes from high out-of-pocket costs through additional subsidies. But people with slightly higher incomes can face high cost sharing within the marketplace’s silver “benchmark” plans, which determine the size of the premium tax credit.3 In many states, the typical single-person deductible can exceed $5,000.4

In recent years, cost sharing in employer-based health plans, long viewed as the top tier of private coverage, also has increased.5 Research shows that people with high deductibles are more likely to skip needed care, delay filling prescriptions, and have problems paying medical bills.6

A bill introduced by Senator Jeanne Shaheen (D–N.H.), S. 499, attempts to address these concerns in the individual market by resetting the marketplace benchmark plan (both single-person and family coverage) from silver to the more comprehensive gold level, among other provisions.7 Funded by the federal government, this policy change would reduce the exposure to out-of-pocket costs that consumers with marketplace plans face by lowering deductibles, copayments, coinsurance, and annual spending limits. Insurers have discretion over which of these levers they choose to adjust in most states.

This analysis explores the cost-sharing effects of turning to a gold-plan benchmark for single-person coverage in the marketplaces and compares this improvement to costs in employer-based coverage.

We use the 2022 HIX Compare dataset curated by the Robert Wood Johnson Foundation, which provides premiums and benefit details of plans sold in the federal and state-based marketplaces, to compare the deductibles and annual out-of-pocket maximum limits of gold and silver plans near the benchmark. We also compare gold and silver plans to single-coverage employer plans using the 2021 Medical Expenditure Panel Survey–Insurance Component (MEPS–IC).

Finally, we examine the potential implications of a policy similar to S. 499 that would provide all marketplace enrollees with incomes above 200 percent of the federal poverty level with access to benchmark plans with the “gold standard” of cost protection.

What Are the Marketplace Plan Categories?

Under the Affordable Care Act (ACA), insurance companies that sell health plans through the federal or state-based marketplaces generally offer plans at four different levels of cost exposure, also known as actuarial value (AV):

  • Bronze plans cover 60 percent of medical costs, on average
  • Silver plans cover 70 percent of medical costs, on average
  • Gold plans cover 80 percent of medical costs, on average
  • Platinum plans cover 90 percent of medical costs, on average.

Plans must offer the ACA essential health benefit package of covered services at each level. The variation among the levels reflects differences among the deductibles (the amount a consumer must pay before the health plan begins to pay for many covered services), the maximum out-of-pocket limits (the most a consumer must pay for covered services in a year), as well as different levels of copayments and coinsurance, and other plan features. Plans with higher actuarial values such as gold and platinum plans typically have less cost sharing and higher premiums.

The federal government permits a modest amount of variation around the target AV value for plans within the different categories — for example, in 2022 a silver plan can be as low as 66 percent AV versus the target of 70 percent AV. The Centers for Medicare and Medicaid Services (CMS) has proposed reducing allowed variation ranges in 2023.8

What Are Cost-Sharing Reductions?

Insurers participating in the marketplaces must offer silver-level plans with reduced cost sharing for people who have incomes between 100 percent and 250 percent of the federal poverty level (FPL) ($12,880 to $32,200 for an individual purchasing a marketplace plan in 2022), including lower limits for the plan’s out-of-pocket maximum. The lower one’s income, the higher the proportion of health care costs covered:

  • 100 percent to less than 150 percent of FPL: eligible for plans with 94 percent AV (referred to in the analysis and exhibits as silver-94 plans)
  • 150 percent to less than 200 percent of FPL: eligible for plans with 87 percent AV (silver-87)
  • 200 percent to less than 250 percent of FPL: eligible for plans with 73 percent AV (silver-73)

What Is a Benchmark Plan?

The ACA bases the premium tax credits available to eligible marketplace consumers on the second-lowest-cost silver plan, referred to as the “benchmark plan.” The tax credit is equal to the premium for the benchmark plan minus the consumer premium contribution, which is based on a percentage of the enrollee’s income. ARPA increased the generosity of these tax credits and expanded them to people at all income levels above 100 percent of FPL, with an upper-range cap of 8.5 percent of income.9 The Inflation Reduction Act extended the ARPA subsidies through 2025.

Under proposed reforms like S. 499, the marketplace benchmark plan would switch from the second-lowest-cost silver plan to the second-lowest-cost gold plan, with an 80 percent actuarial value.

How Would Switching to a Gold-Plan Benchmark Affect Affordability?

Baumgartner_new_gold_standard_Exhibit_01

Marketplace enrollees with incomes between 100 percent and 200 percent of FPL are eligible for plans that significantly reduce their out-of-pocket costs as a result of the ACA’s cost-sharing reduction subsidies. The median individual-coverage deductibles for these silver-87 and silver-94 plans in our sample10 are $750 and $0, respectively (Exhibit 1) (see “What Are the Marketplace Plan Categories?” in the box above for plan definitions). This is much lower than silver, gold, and 2021 employer plans and closer to the cost protection of Medicaid, which covers people in expansion states with incomes up to 138 percent of FPL.11

Moving the benchmark plan to gold would have the biggest effects on cost sharing for people who receive minimal or no cost-sharing reductions (those who earn 200% FPL and above). The median deductible in marketplace gold plans is $1,450, which is less than half the size of silver-73 plans ($3,450) and more than three times less than traditional silver plans with no cost-sharing reductions ($5,000). It is similar to the median deductibles found within 2021 single-coverage employer plans ($1,600).

Baumgartner_new_gold_standard_Exhibit_02

The out-of-pocket maximum is the most a consumer would have to pay in a given year for any covered in-network services. Once a consumer spends their out-of-pocket maximum, the health plan pays 100 percent of any additional covered services. In 2022, out-of-pocket limits in the marketplace cannot exceed $8,700 for individual plans. Still, this is a significant amount of money for someone with a moderate income.

Median individual-coverage annual out-of-pocket maximums in our sample are highest in silver plans and lowest among silver-94 and silver-87 plans.

Moving the benchmark plan to the gold plan would improve overall cost protection but still leave consumers who earn too much to qualify for cost-sharing reductions with a median out-of-pocket maximum of $7,500 (Exhibit 2). This is significantly higher than the out-of-pocket maximum for employer plans ($4,500). Research shows that employer-based plans have a higher average actuarial value than gold plans.12

Baumgartner_new_gold_standard_Exhibit_03

We found considerable interstate variation among deductibles for individual silver plans. The median deductible ranges from $1,875 in New York to $6,100 in Arkansas, Kansas, and Nevada, and it is at least $4,000 in 37 states (Exhibit 3). Although there is also variation among gold-plan deductibles, the deductibles are lower than the silver plan in every state and less than $2,000 in all but 10 states.

Silver-73 plans available to people with incomes between 200 percent and 250 percent of FPL offer some assistance, but those deductibles are still well above the level of gold plans in many states.13

Gold-plan deductibles in most states are at similar levels to the median deductible in 2021 employer plans, and even lower in 34 states.

Baumgartner_new_gold_standard_Exhibit_04

We found little interstate variation among out-of-pocket maximums for individual silver plans. The median annual limit ranges from $6,275 in Rhode Island to $8,700 (the statutory limit) in 15 states. In 45 states, it is at least $8,000 (Exhibit 4).

There is more variation among gold plans. The median out-of-pocket maximum ranges from $4,275 in New York to $8,700 in Connecticut, with most states centered around $7,000. Although gold out-of-pocket maximums are below those in silver plans in most states, they are still above those in employer plans in every state but one (New York).

Baumgartner_new_gold_standard_Exhibit_05

In a given year, consumers face total potential out-of-pocket costs that are largely composed of their insurance premium contributions and the annual maximum limit on out-of-pocket spending paid through deductibles, copayments, and coinsurance. Depending on the household and state of residence, that financial burden can take up very different percentages of total household income.

As depicted in Exhibit 5, we calculated the median percentage of income that a 50-year-old at 300 percent of FPL ($38,640 for those purchasing a 2022 plan) in each state would pay in combined premium and out-of-pocket-maximum costs for a silver marketplace plan, compared to a gold or employer plan.14 People at 300 percent of FPL currently receive no cost-sharing reductions.

Within silver plans, the potential financial burden is at least 25 percent of income ($9,660) in nearly every state.15

In a majority of states, making the gold plan the benchmark would lower that potential burden by 2 percent to 5 percent of income ($770 to $1,930), depending on the state of residence. More than half of states would fall below the 25 percent threshold, and six would fall below 20 percent of income. While an improvement, these potential costs are still well above the financial burden faced by people in that income range who have employer coverage. The median potential total costs for employer plans are below 20 percent of income in all states and below 15 percent of income in 21 states. These differences are driven by lower premium contributions within employer plans in many states, as well as the lower out-of-pocket annual maximum limits shown in the fourth exhibit.16

Discussion

Changing the marketplace benchmark plan from silver to gold could help reduce deductibles and out-of-pocket limits and bring the level of marketplace cost protection closer to that of employer coverage — a finding that holds true virtually everywhere in the United States. The change would particularly benefit consumers with incomes between 200 percent and 300 percent of FPL, who currently receive minimal, or no, cost-sharing reductions (CSRs) under current law.

The increased financial protection of gold plans at an 80 percent actuarial value (AV) level is a clear improvement from the 70 percent AV protection in silver plans and will help reduce overall out-of-pocket spending. But benefit design can still leave some people more exposed to health care costs than others, depending on how much health care they need in a given year.

Although benchmark deductibles would drop considerably based on 2022 data, gold plan annual out-of-pocket limits are still several thousand dollars above those in employer plans in most states. These high out-of-pocket maximums can leave people exposed if they require significant health services in a given year — particularly those with chronic conditions, or those who have a serious illness or accident — while the lower deductibles will benefit people who use the health system less frequently. CMS has tried to balance these trade-offs in the standardized plans they have proposed for the 2023 plan year.17

To increase protection and minimize consumer confusion, policymakers could consider further standardizing benefit design and further increasing cost-sharing subsidies and extending them up the income scale (as S. 499 proposes).

The behavior of insurers and consumers also will need to be considered. To keep benchmark premiums lower and attract enrollees, insurers may offer more gold plans at the lowest allowed level of protection, resulting in higher consumer cost sharing. In 2022, gold plans can hold an actuarial value as low as 76 percent. CMS has proposed raising that floor to 78 percent in 2023.18

Consumers also may face incentives to choose less-protective plans. After the Trump administration stopped reimbursing insurers for CSRs in 2017, insurers were allowed to include those costs in benchmark silver-plan premiums (known as “silver loading”).19 This increased the value of premium tax credits for those eligible, which significantly lowered the net premium costs for other plan categories. As a result, enrollment increased in both less-generous bronze and more-generous gold plans, as well as in the marketplaces generally.20 Similar trends could occur under a gold benchmark if direct CSR payments are not resumed.

Changing the benchmark to gold will require an increase in federal spending to finance the improved cost protections and any increase in marketplace enrollment that those plans could attract. A 2022 Urban Institute report on affordability reforms suggests that implementing a bill similar to S. 499 that moves to a gold benchmark, further increases CSRs and extends them up the income scale, and resumes direct CSR payments could result in a federal budget cost of more than $13 billion per year.21

While more work remains to be done, policies like S. 499 would represent an important first step in addressing stubbornly high underinsurance within the individual market that has persisted despite the ACA’s reforms.22 Modest changes like these could encourage more people to get the care they need and keep them from incurring medical debt.

HOW WE CONDUCTED THIS STUDY

This analysis uses data from the 2022 HIX Compare dataset, produced by the Robert Wood Johnson Foundation, and the insurance component of the 2021 Medical Expenditure Panel Survey (MEPS–IC), produced by the Agency for Healthcare Research and Quality (AHRQ).

The HIX Compare dataset includes information on premiums, cost sharing, and other provisions for health insurance plans in the individual market for all 50 states and the District of Columbia. MEPS–IC includes state and national data on the premium contributions and cost-sharing provisions within employer-sponsored health plans, among other information.

Individual Marketplace Analysis — HIX Compare

Within HIX Compare, we limited our analysis to individual-market plans that were sold on state or federal ACA marketplaces. We excluded plans that were only for children. We used the dataset’s information on individual plan premium costs, as well as the in-network deductible and annual out-of-pocket maximum limit. Plans often have “integrated” deductibles that include both medical and drug services and do not distinguish between the two, but some plans have separate provisions for each set of services. For this analysis, we used the integrated or medical deductible and out-of-pocket maximum for each individual-coverage plan as our unit of analysis.

The ACA marketplaces within each state are divided into a set number of “rating areas” that issuers must use to adjust premium rates uniformly. The HIX Compare dataset reports plan information at the rating-area level.23

To produce national and state estimates for deductibles and out-of-pocket maximums, we separated available plans into the different “metal” categories (i.e., silver, silver-73/87/94, gold). For each category, we then identified the plan in each rating area with the second-lowest monthly premium for 50-year-old individual coverage (the “benchmark”). We limited our sample to plans in each rating area that were within $100 in monthly premium costs to the benchmark plan for each plan category. This allowed us to analyze plans that may be preferred by consumers because of lower premiums, while acknowledging that many people may not choose the benchmark plan itself. We then identified the median deductible and out-of-pocket maximum in each rating area and plan category among this sample of plans to create the “selected plan” for each rating area and category.

For national deductible or out-of-pocket maximum estimates, we reported the median value among the selected plans across all rating areas in the United States, weighted by the nonelderly population (ages 0–64) in each rating area.24 For state estimates, we reported the population-weighted median value among the selected plans across all rating areas in an individual state.

For the last exhibit, in each rating area we added together the premium cost and annual out-of-pocket maximum that a 50-year-old individual at 300 percent of the federal poverty level (FPL) faced for the selected plan in each category. For people at 300 percent of FPL, the premium amount for a benchmark plan is capped at 6 percent of income under the American Rescue Plan Act (a provision now extended through 2025 in the Inflation Reduction Act). We then calculated the combined potential costs as a percentage of income. We reported the population-weighted median percentage of income across all rating areas in an individual state or nationally.

Massachusetts and Vermont offer more generous cost-sharing subsidies for people between 200 percent and 300 percent of FPL, and Massachusetts premium subsidies are more generous than ARPA/IRA levels for certain income groups. In all applicable exhibits, we assigned those states with the lower deductibles, out-of-pocket maximums, and premium contributions.

Employer Plan Analysis — MEPS–IC

For the first four exhibits, the annual MEPS–IC release includes national and state estimates for the median premium contribution, deductible, and out-of-pocket annual maximum within single-coverage private employer plans.25

For the last exhibit, in each state we added together the median premium contribution and out-of-pocket maximum for single-coverage employer plans. We then calculated the combined potential costs as a percentage of income.

Limitations

This analysis has limitations. First, the HIX Compare dataset reports plan information at the rating-area level, but some issuers may not offer certain plans to all counties within the rating area. Second, because some plans offer separate medical and drug deductibles, the medical-only deductibles analyzed in this report may be lower than similar plans with integrated deductibles. Third, while we focused our analysis on hypothetical 50-year-old individuals, younger age groups typically face lower premium costs.

ACKNOWLEDGMENTS

The authors are grateful to David Anderson of the Duke-Margolis Center for Health Policy for helpful feedback; David Radley of the Commonwealth Fund for providing population weight estimates; the Fund’s David Blumenthal and Melinda Abrams for review and constructive guidance; and the Fund’s communications and data support teams, including Chris Hollander, Paul Frame, Jen Wilson, Celli Horstman, Lauren Haynes, Arnav Shah, and Evan Gumas.

NOTES
  1. Katie Keith, “Record-High Marketplace Enrollment, New Census Data, and More,” Health Affairs Forefront, Sept. 21, 2021; and Katie Keith, “Marketplace Enrollment Reaches New Record of 14.5 Million,” Health Affairs Forefront, Jan. 31, 2022.
  2. Amy B. Wang, “Biden Signs Sweeping Bill to Tackle Climate Change, Lower Health-Care Costs,” Washington Post, Aug. 16, 2022.
  3. Naomi Zewde, “Did Marketplace Coverage Really Offer Financial Protection? Financial GAINs from the Affordable Care Act’s Private Insurance Policies Among the Previously Uninsured,” Journal of Risk and Insurance 88, no. 2 (July 2021): 413–27.
  4. Commonwealth Fund analysis of 2022 HIX Compare dataset. See “How We Conducted This Study” for more detail.
  5. Sara R. Collins, David C. Radley, and Jesse C. Baumgartner, State Trends in Employer Premiums and Deductibles, 2010–2020 (Commonwealth Fund, Jan. 2022).
  6. Sara R. Collins, Munira Z. Gunja, and Gabriella N. Aboulafia, U.S. Health Insurance Coverage in 2020: A Looming Crisis in Affordability — Findings from the Commonwealth Fund Biennial Health Insurance Survey, 2020 (Commonwealth Fund, Aug. 2020).
  7. 117th Congress, Improving Health Insurance Affordability Act of 2021, S.499.
  8. Rose C. Chu et al., Facilitating Consumer Choice: Standardized Plans in Health Insurance Markets (ASPE, Dec. 2021).
  9. Timothy S. Jost, “What Does the American Rescue Plan Mean for Health Care Coverage?,” To the Point (blog), Commonwealth Fund, Mar. 12, 2021.
  10. Our analysis framework focuses on marketplace plans near the second-lowest-premium plan in each rating area and metal category. See “How We Conducted This Study” for more details.
  11. Heidi Allen et al., “Comparison of Utilization, Costs, and Quality of Medicaid vs Subsidized Private Health Insurance for Low-Income Adults,” JAMA Network Open 4, no. 1 (Jan. 2021): e2032669.
  12. Paul Frontsin et al., The More Things Change, the More They Stay the Same: An Analysis of the Generosity of Employment-Based Health Insurance, 2013–2019 (EBRI, Oct. 2021).
  13. Massachusetts and Vermont both offer additional cost-sharing subsidies to people under 300 percent of FPL, which can result in different trends for silver CSR variant deductibles and annual limits. See Jason Levitis and Sonia Pandit, “Supporting Insurance Affordability with State Marketplace Subsidies,” State Health and Value Strategies, Mar. 11, 2021.
  14. Marketplace plan premium costs are calculated as a percentage of income based on the premium subsidy schedule established under the American Rescue Plan Act of 2021 and recently extended under the Inflation Reduction Act. See “How We Conducted This Study” for more details.
  15. Massachusetts and Vermont offer enhanced CSR plans for people up to 300 percent of poverty, which are reflected in the analysis. See “How We Conducted This Study” for more details.
  16. Collins, Radley, and Baumgartner, State Trends, 2022; MEPS–IC State and Metro Area Tables, 2021 – Tables X.C.1 (single-coverage premium contributions), and X.G.1 (single-coverage out-of-pocket maximums).
  17. Chu et al., “Facilitating Consumer Choice,” 2021.
  18. Chu et al., “Facilitating Consumer Choice,” 2021.
  19. Timothy S. Jost, “Administration’s Ending of Cost-Sharing Reduction Payments Likely to Roil Individual Markets,” Health Affairs Forefront, Oct. 13, 2017; and Andrew Sprung and David Anderson, “Getting Full Benefit from Silver Loading: How the Biden Administration Can Regulate to Make Care More Affordable,” Health Affairs Forefront, Feb. 23, 2021.
  20. Matthew Fiedler, The Case for Replacing Silver Loading, Brookings Institution, May 20, 2021; Petra W. Rasmussen, Thomas Rice, and Gerald F. Kominski, “California’s New Gold Rush: Marketplace Enrollees Switch to Gold-Tier Plans in Response to Insurance Premium Changes,” Health Affairs 38, no. 11 (Oct. 2019): 1902–10; and Andrew Sprung, “The Dark Side of Free Bronze Plans: Erosion of CSR Silver Enrollment Accelerates,” XPOSTFACTOID, Apr. 22, 2021.
  21. See John Holahan and Michael Simpson, Next Steps in Expanding Health Care Coverage and Affordability: What Policymakers Can Do Beyond the Inflation Reduction Act (Commonwealth Fund, Sept. 2022). Analysis includes integration with four additional affordability reforms and is not a direct estimate of S. 499 in comparison to current marketplace federal spending levels.
  22. Collins, Gunja, and Aboulafia, U.S. Health Insurance Coverage, 2020.
  23. There are 502 rating areas nationally across all states.
  24. Rating area nonelderly population counts estimated using 2020 American Community Survey Public Use Microdata Sample (ACS PUMS). Weighting methodology follows other analyses such as: Marketplace Competition and Premiums, 2019–2022 (Urban Institute, 2022).
  25. MEPS–IC State and Metro Area Tables, 2021 – Tables X.C.1 (single-coverage premium contributions), X.F.1 (single-coverage deductibles), and X.G.1 (single-coverage out-of-pocket maximums).

Publication Details

Date

Contact

Jesse C. Baumgartner, Former Senior Research Associate, Health Care Coverage and Access & Tracking Health System Performance, The Commonwealth Fund

Citation

Jesse C. Baumgartner, Munira Z. Gunja, and Sara R. Collins, The New Gold Standard: How Changing the Marketplace Coverage Benchmark Could Impact Affordability (Commonwealth Fund, Sept. 2022). https://doi.org/10.26099/9j2e-hh59