
Advanced Search

Advanced Search

Current Filters

Filter your query

Publication Types

Other

to

Issue Briefs

/

How Medicaid and SNAP Cutbacks in the “One Big Beautiful Bill” Would Trigger Big and Bigger Job Losses Across States

Woman holds up paperwork and folder in front of her chest.

A job-seeker holds paperwork given out at the Global Assistance booth at the Mega JobNewsUSA South Florida Job Fair at the Amerant Bank Arena on April 30, 2025, in Sunrise, Fla. In 2029, cuts to Medicaid and SNAP would result in the loss of 1.2 million jobs nationwide, equivalent to a 0.8-percentage-point increase in the unemployment rate. Photo: Joe Raedle/Getty Images

A job-seeker holds paperwork given out at the Global Assistance booth at the Mega JobNewsUSA South Florida Job Fair at the Amerant Bank Arena on April 30, 2025, in Sunrise, Fla. In 2029, cuts to Medicaid and SNAP would result in the loss of 1.2 million jobs nationwide, equivalent to a 0.8-percentage-point increase in the unemployment rate. Photo: Joe Raedle/Getty Images

Toplines
  • Proposed Medicaid and SNAP cuts in the budget bill moving through Congress could cost states far more than the federal government would save

  • Projected losses in 2029 include 1.2 million jobs and $154 billion in state GDPs; state and local tax revenues could plummet $12.2 billion

Toplines
  • Proposed Medicaid and SNAP cuts in the budget bill moving through Congress could cost states far more than the federal government would save

  • Projected losses in 2029 include 1.2 million jobs and $154 billion in state GDPs; state and local tax revenues could plummet $12.2 billion

Abstract

  • Issue: The budget reconciliation bill recently passed by the House of Representatives (the One Big Beautiful Bill) reduces federal funding for Medicaid by $863 billion and for the Supplemental Nutrition Assistance Program (SNAP) by $295 billion over 10 years.
  • Goal: To estimate the impact of the bill on the economies, employment, and state and local tax revenues for every state and the District of Columbia in 2029, when the policies are fully implemented.
  • Methods: We compute federal funding reductions for Medicaid and SNAP programs in each state using Congressional Budget Office estimates, along with recent Medicaid and SNAP data. We then use the IMPLAN modeling program to estimate economic effects.
  • Key Findings and Conclusions: In 2029, cuts to Medicaid and SNAP would cause state gross domestic products to fall by $154 billion, 18 percent more than the $131 billion they would save the federal government. The cuts would result in the loss of 1.22 million jobs nationwide, equivalent to a 0.8-percentage-point increase in the unemployment rate. States with higher rates of poverty would likely be harmed more. State and local tax revenues would fall by $12 billion. Additional fallout from budget cuts to the health insurance marketplaces and the sequestration of Medicare funding will further harm the economy and employment.

Introduction

On May 22, 2025, the U.S. House of Representatives passed the “One Big Beautiful Bill Act,” its budget reconciliation bill. The Senate has begun to propose potential changes, but it is too early to know what the Senate will end up doing.1 Narrowly passed in the House on a party-line basis, the legislation includes an estimated $863 billion in budget cuts for Medicaid and $295 billion in cuts for the Supplemental Nutrition Assistance Program (SNAP) for fiscal years 2025 to 2034.2 The combined cuts exceed $1 trillion. Although President Trump has said he “loves and cherishes” Medicaid and Medicare,3 he strongly supports the bill.4

The Congressional Budget Office (CBO) projects that, if enacted, the bill will cause 10.9 million Americans to become uninsured, either from the loss of Medicaid or from coverage losses in the Affordable Care Act (ACA) marketplace. An additional 5.1 million people will lose coverage when the enhanced marketplace premium tax credits expire at the end of 2025, among other reasons.5 Together, the number of uninsured Americans could be 16 million higher in 2034 than it would be without these changes. The CBO further projects that the bill will lower SNAP enrollment by an average of 4.7 million, and that Americans remaining in SNAP will see their nutrition allotments reduced.6

Cuts to the ACA insurance marketplace will also lower federal funding for health care and increase the number of uninsured people. The end of the enhanced premium tax credits will compound these effects.7 Finally, the CBO noted that increases in the federal budget deficit caused by the bill could trigger “sequestration,” which could require a $500 billion cut in Medicare funding.8

By cutting safety-net programs, the House budget bill reduces resources for low-income households (the lowest 10% of earners) by an average of $1,600. At the same time, the bill’s tax cuts increase resources for high-income households (the highest 10% of earners) by $12,000. Despite the spending cuts, the bill would increase the federal deficit by $3 trillion, including about $500 billion in higher interest costs.9

This brief analyzes the economic, employment, and tax consequences of the One Big Beautiful Bill Act for each state and the District of Columbia, as passed by the House. An earlier brief, written before the House bill was developed, examined the effects of hypothetical changes to Medicaid and SNAP policies, assuming that the changes were broad-based and spready evenly over the 2025–34 period and proportionately across states.10 This updated brief examines the effects of the specific policies that were approved by the House. The box below summarizes the bill’s key Medicaid- and SNAP-related policies.

Key Medicaid and SNAP Provisions in the House Budget Reconciliation Bill

Medicaid11

  • Mandates work reporting requirements for adults ages 19 to 64 covered through the Medicaid expansion by end of December 2026.
  • Requires cost sharing for Medicaid expansion adults with incomes above 100 percent of the federal poverty level.
  • Requires shorter certification periods for Medicaid expansion adults.
  • Prohibits implementation of regulations related to eligibility and enrollment in Medicaid, CHIP, and Medicare Savings Programs and related to staffing standards for nursing homes until 2035.
  • Cancels future American Rescue Plan Act incentive payments for states that newly expand Medicaid eligibility.
  • Cuts the matching rate for expansion populations in states that use their own funds to serve undocumented or nonqualified immigrants.
  • Prohibits gender-affirming care.
  • Prohibits payments to certain family planning providers.
  • Freezes state Medicaid provider taxes at current levels and limits use of state-directed payments.
  • Delays disproportionate share hospital (DSH) payment reductions.

Supplemental Nutrition Assistance Program12

  • Expands work reporting requirements for adults from an upper limit of age 54 to age 64 and lowers the age limit for dependent children from 18 to 7.
  • Requires a state match for SNAP benefits of between 5 percent and 25 percent, based on each state’s payment error rate, beginning in 2028.
  • Halves federal funding for administrative payments from 50 percent to 25 percent.
  • Lowers the tolerance limit for payment errors from $57 to $0.
  • Limits increases in SNAP benefits based on the Thrifty Food Plan to the Consumer Price Index.
  • Prohibits participation by persons who are not citizens or lawful permanent residents.

Timing and Depth of State Medicaid and SNAP Cutbacks

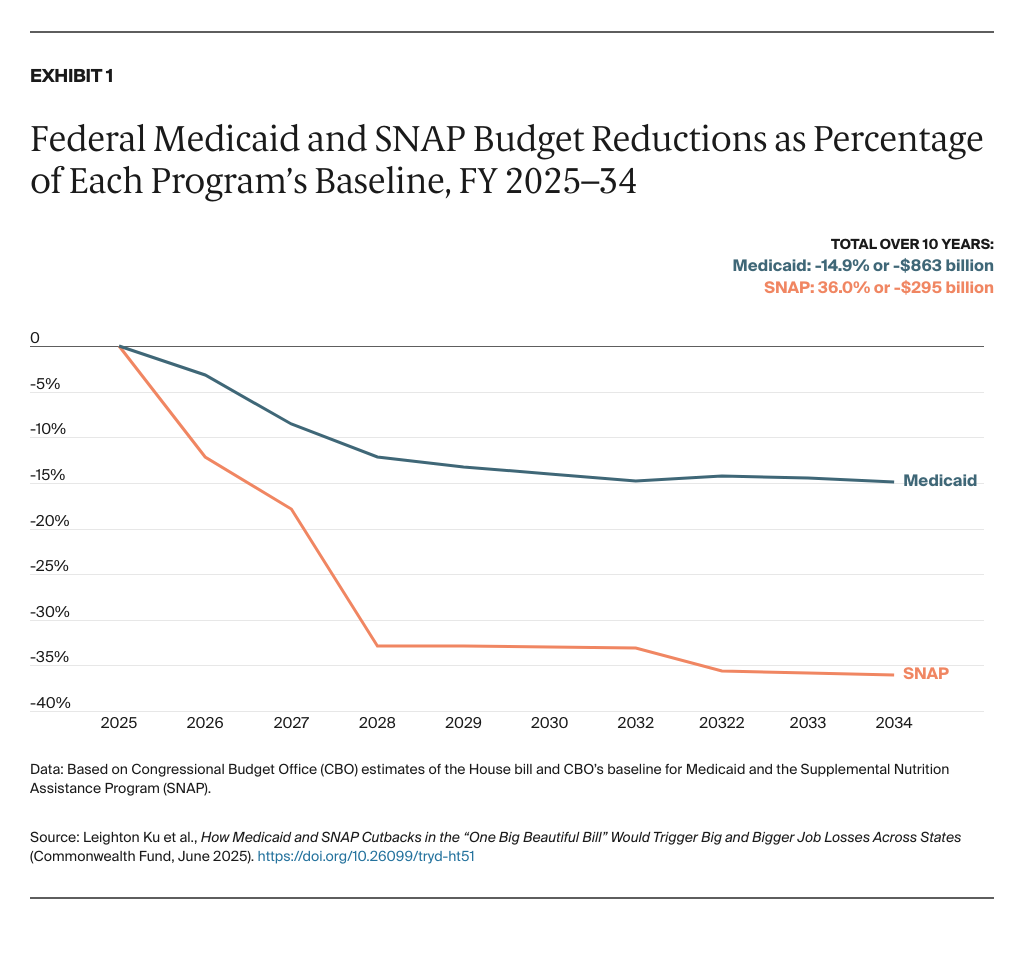
Although the budget reconciliation bill is often described in terms of the federal savings it will produce, the cost of the cuts outlined above will be borne by states, their businesses, and their residents. Since the legislation is phased, the impact of these bills deepens over time, as illustrated in Exhibit 1.

Ku_medicaid_snap_cutbacks_OBBB_job_losses_Exhibit_01

Last-minute changes in the House bill hastened the Medicaid cuts, particularly by advancing the date for work requirements from January 2029 to December 31, 2026. The reductions deepen substantially from 2026 to 2028 before easing in subsequent years. While the funding reductions are larger for Medicaid than for SNAP ($863 billion vs. $295 billion, respectively), the relative size of the cuts are deeper for SNAP, which will see a 36 percent cut by 2034, compared to 15 percent for Medicaid.

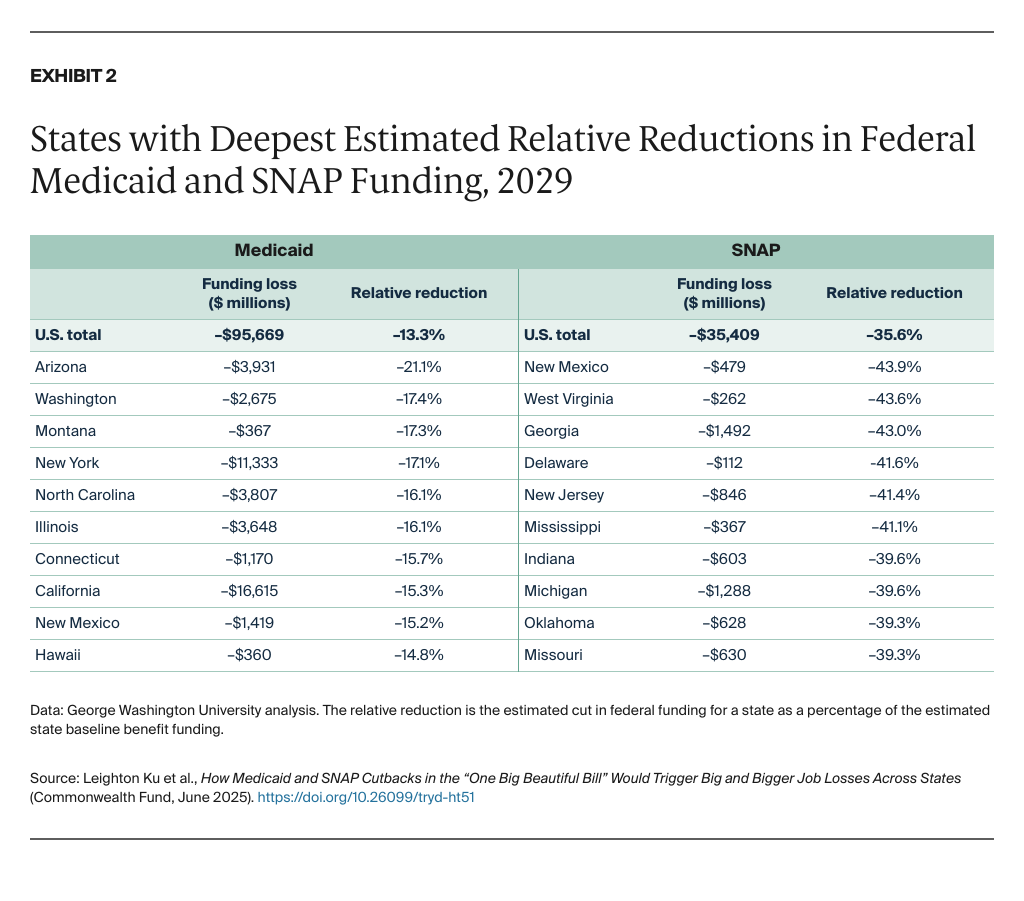
The House-passed bill was also designed to cut funding disproportionately in certain states — harming businesses and residents unevenly across the nation. Exhibit 2 displays the 10 states with the deepest reductions in federal funding for Medicaid and SNAP in 2029, compared to estimates of baseline spending for program benefits. (The appendix tables at the end of this brief contain detailed results for Medicaid, SNAP, and the combination of Medicaid and SNAP.) We acknowledge there is some uncertainty about projections of funding several years from now; our estimates are based on the most recent data available. To learn how we calculated them, see “How We Conducted This Study.”

Ku_medicaid_snap_cutbacks_OBBB_job_losses_Exhibit_02

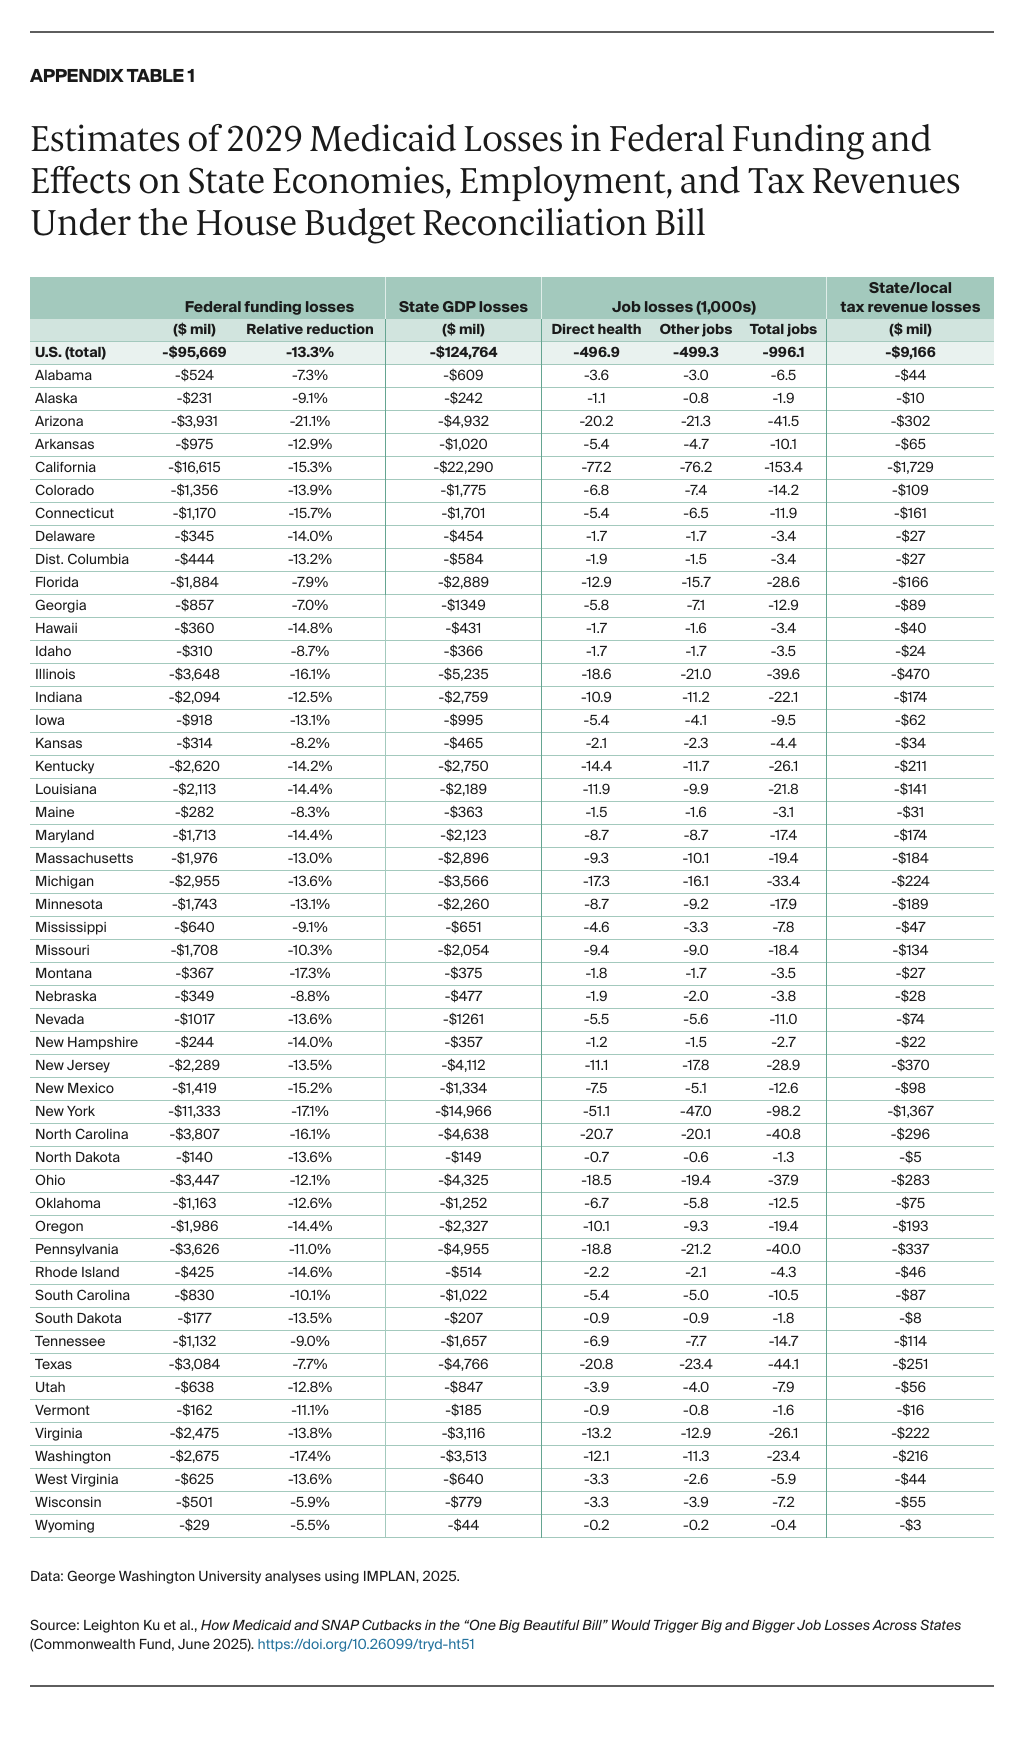
Overall, 13.3 percent of federal Medicaid funding ($95.7 billion) would be lost nationwide in 2029. Some states would have deeper losses than others. For example, Arizona would lose 21.1 percent of its federal funding, while Wyoming would lose 5.5 percent — still a substantial cut.

A key factor in the severity of a state’s Medicaid cut is whether it is one of the 40 states that expanded Medicaid eligibility for adults under the ACA: several elements of the bill, the new work requirements in particular, target funding for expansion enrollees. The 10 states that did not expand eligibility tend to have lower reductions, a 7.9 percent loss, on average, from the baseline versus a 14.5 percent loss for expansion states. But nonexpansion states will become ineligible for incentive payments authorized under the American Rescue Plan Act that temporarily help them lower costs if they choose to expand Medicaid in future years (North Carolina, Missouri, South Dakota, and Oklahoma have received these payments).

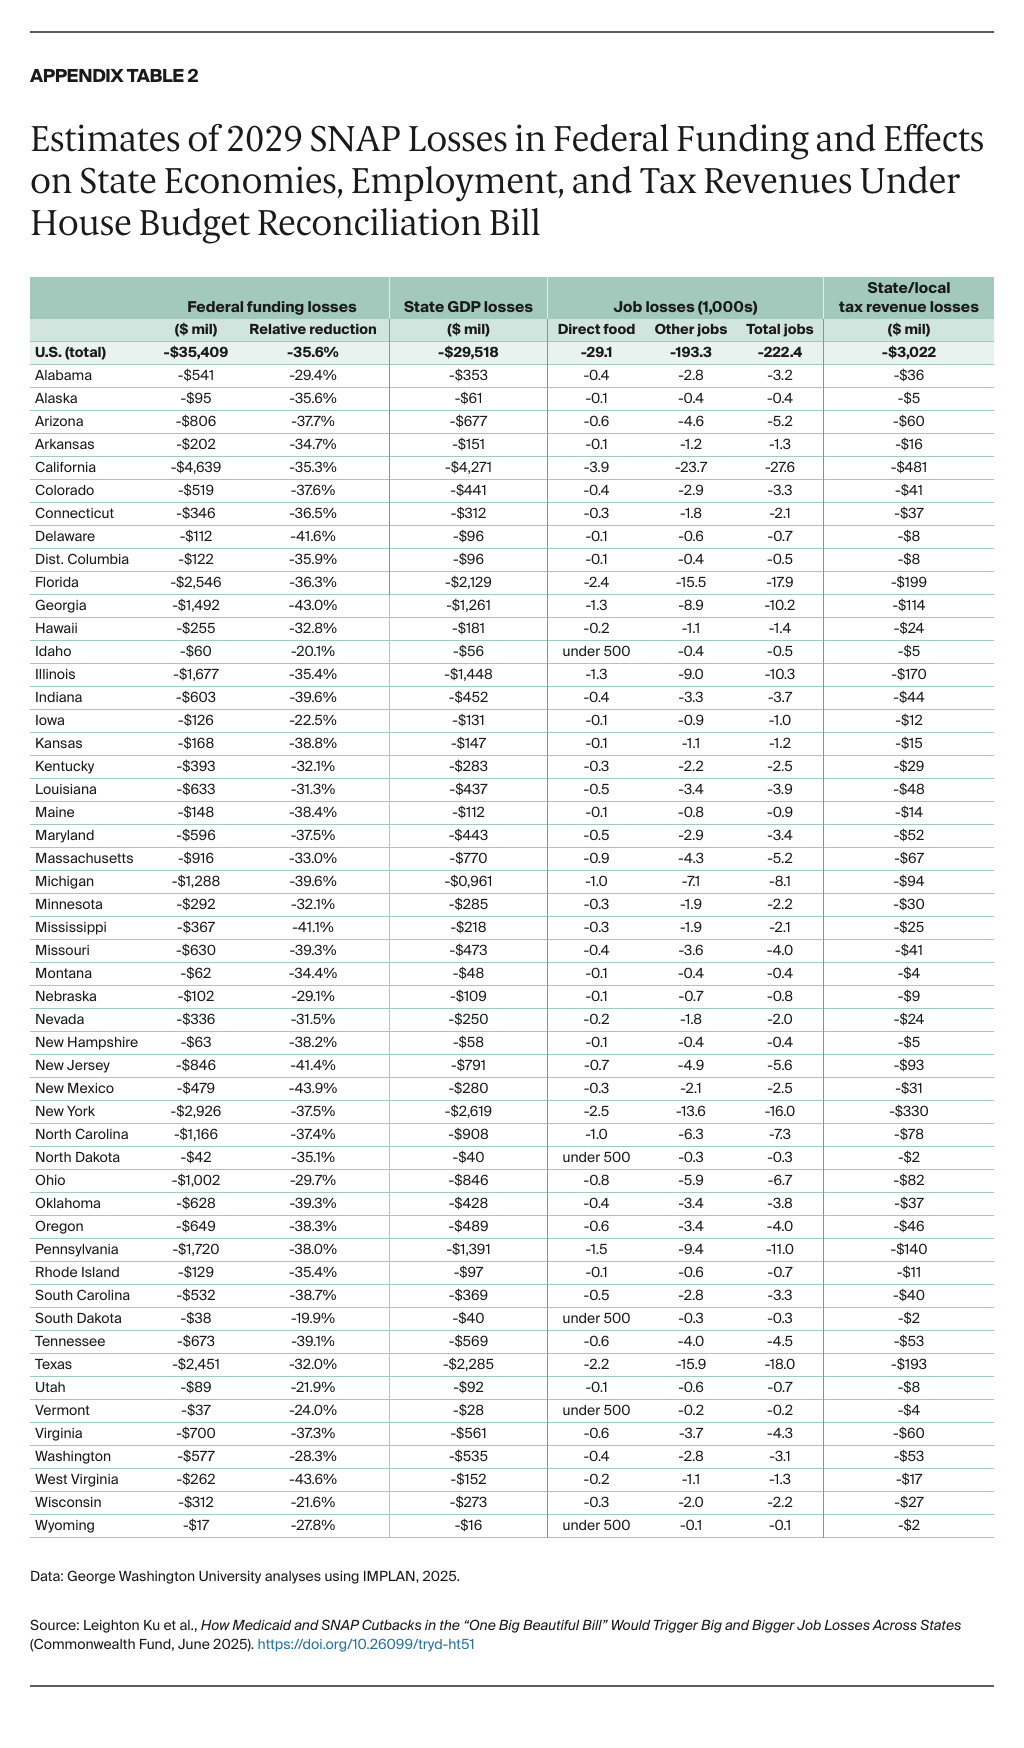
The cuts to SNAP are deeper in relative terms, with federal benefit funding decreasing 36 percent by 2029.13 New Mexico is projected to experience the deepest relative cut (43.9%), while South Dakota, with the smallest relative cut, has a 19.9 percent loss.

The largest factor affecting the relative level of SNAP cuts in the bill is the state match requirement, which shifts $128 billion in federal costs to the states. The match rate would range from a minimum of 5 percent to a maximum of 25 percent for states with the highest SNAP payment error rates.14 Many of the states with the deepest losses are in the South and Midwest. How states will find the state dollars for the required matches, which could reach hundreds of millions of dollars, is unclear. If certain states cannot afford the funds, they may be forced to opt out of SNAP for all their residents.

Federal Medicaid funding cuts will have both direct and indirect effects on the number of Americans receiving Medicaid or SNAP benefits. For example, imposing work requirements for Medicaid and SNAP enrollees, or prohibiting implementation of Biden-era eligibility and enrollment regulations for Medicaid, will directly reduce participation in these programs, as the CBO and others have projected. The minority staff for the House–Senate Joint Economic Committee provided preliminary state-by-state estimates of people losing health insurance because of the bill, ranging from 15,500 in Wyoming and 51,000 in Maine to 212,000 in Missouri and nearly 2 million in California.15

Other policies, such as the SNAP state match, limits on Medicaid health care provider taxes, and state-directed payments, do not directly affect eligibility or benefits but are likely to lead states to limit eligibility and benefits. Since these provisions lower federal funding that states draw on to support program services, states will be forced to compensate for the losses in some fashion.

Because of balanced-budget requirements, nearly all states will need to consider whether to raise taxes, find other revenue, cut optional Medicaid program eligibility or services (SNAP has relatively few state options), reduce provider reimbursement rates, or drop out of SNAP altogether. Some states might discontinue the ACA Medicaid expansion for adults; in fact, nine states have “trigger laws” to terminate the eligibility expansions if the 90 percent federal matching rate is reduced (Arizona, Arkansas, Illinois, Indiana, Montana, New Hampshire, North Carolina, Utah, and Virginia), while three other states are required to mitigate the loss of expansion funding (Idaho, Iowa, and New Mexico).16 States also could cut optional Medicaid services, such as home- and community-based care for elderly and disabled beneficiaries or dental care for adults, or optional eligibility for children.17

Economic, Employment, and Tax Consequences

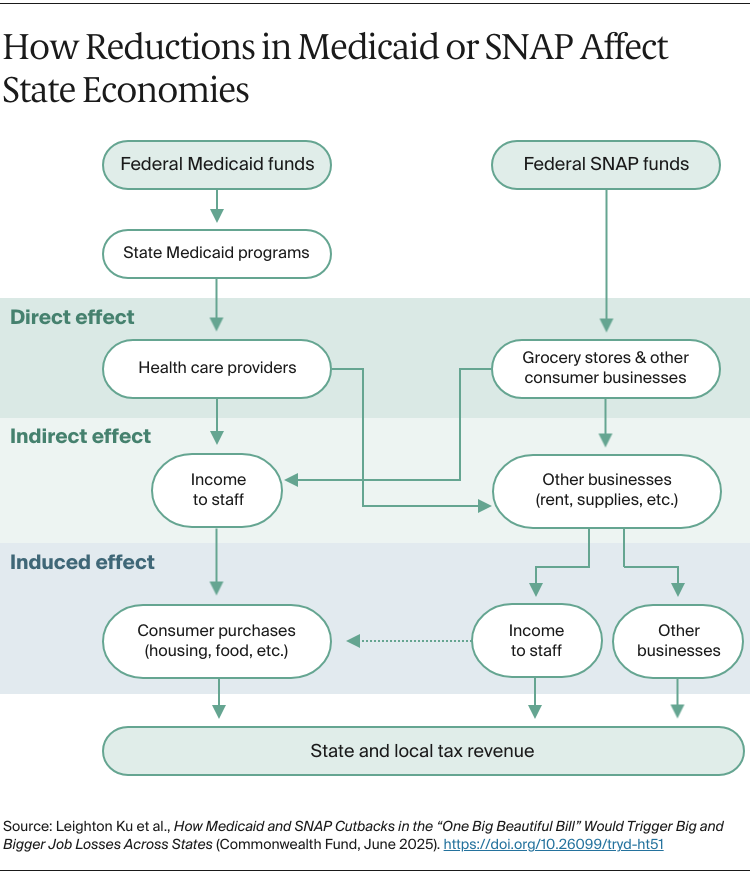
Our analyses of the economic, employment, and tax effects of the Medicaid and SNAP cutbacks are based on the estimated federal funding reductions for each state in 2029. We analyzed these data using the IMPLAN economic modeling system to estimate the impacts on state economies, jobs, and state and local tax revenues.18 The IMPLAN system estimates the “multiplier effect” of the federal funding losses as they ripple across the states, first lowering revenue for health care providers (or food-related businesses) and then affecting other businesses in their supply chains and the employment and incomes of people they employ. All projections are compared to an estimated baseline of economic conditions in 2029 to provide estimates in the absence of legislative changes. Following are key findings at the national level.

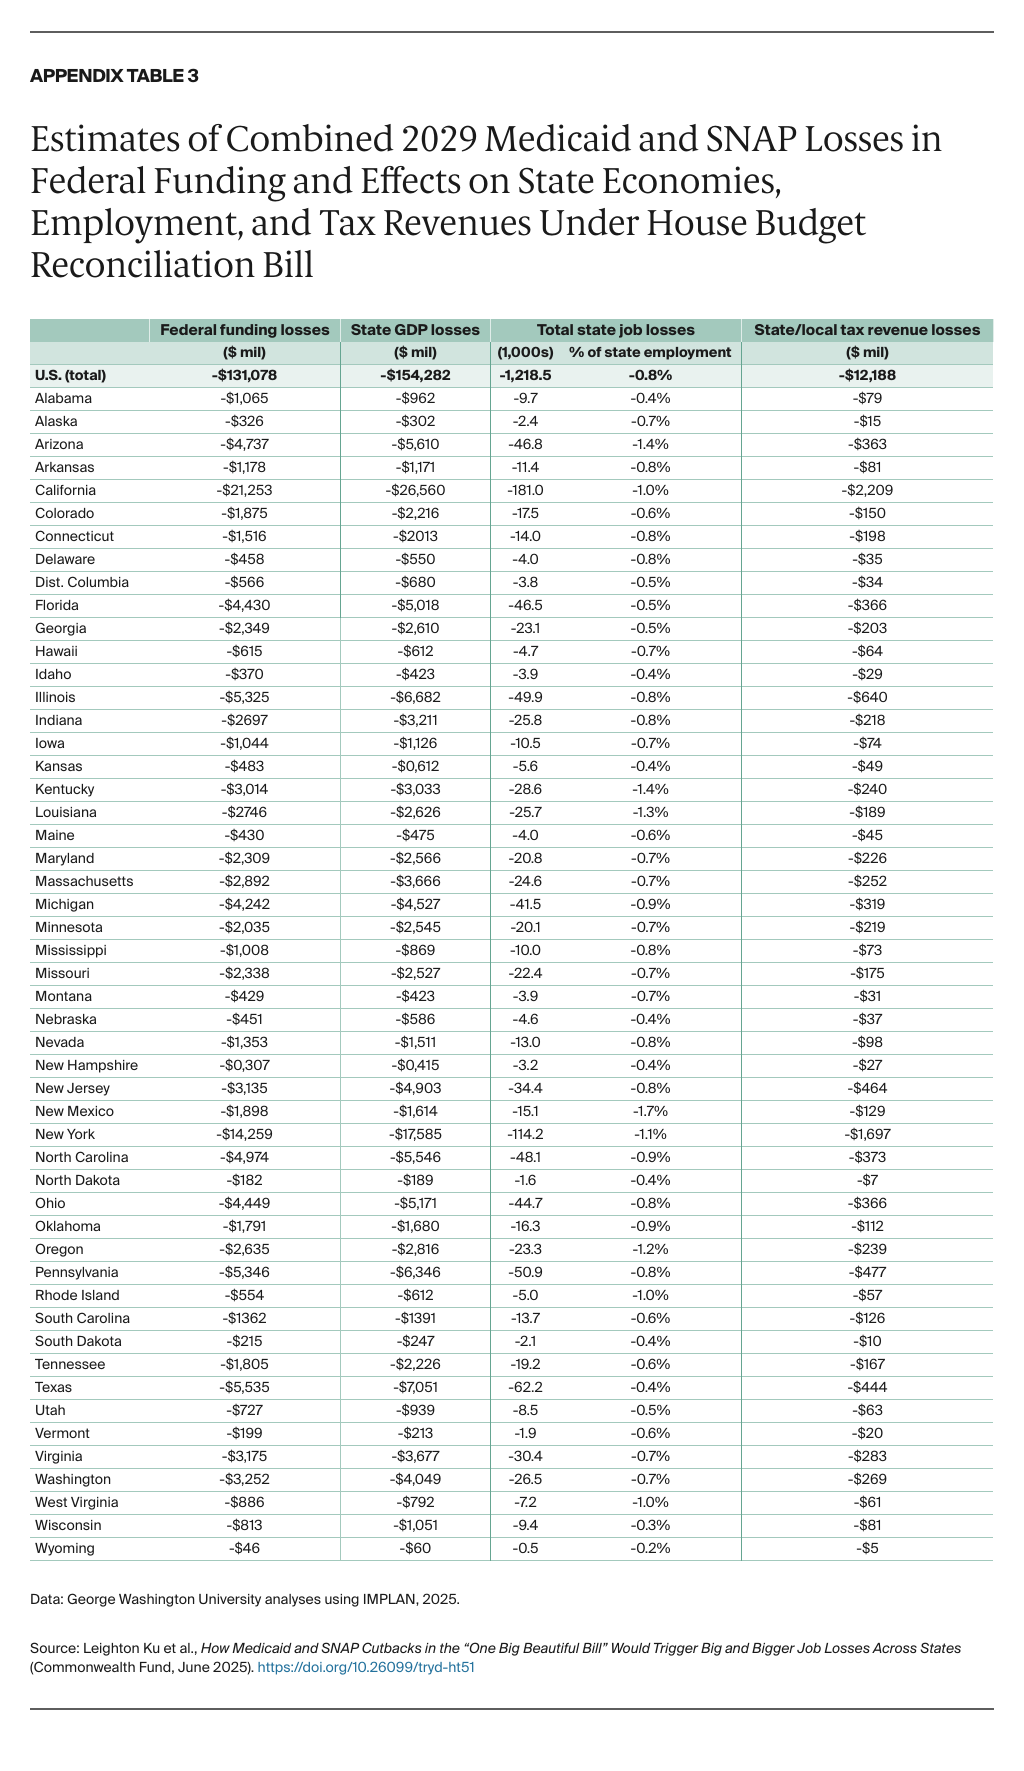
State gross domestic products (GDPs) will fall by $154.3 billion, 18 percent more than the federal savings ($131.1 billion) gained from the funding cuts. The cuts in Medicaid and SNAP would lead to massive reductions in revenue for health care providers and food-related businesses (grocery stores, food producers, and farms), the effects of which would then ripple across other state economic sectors. The severe economic losses sustained by states, including their businesses and residents, would outweigh the federal savings.

Nationwide, 1.22 million jobs could be lost in 2029 due to Medicaid and SNAP cuts. The economic setbacks will, in turn, reduce the number of jobs in each state and increase unemployment rates. Nearly 500,000 jobs would be lost in health care (for example, hospitals, physician and clinic offices, pharmacies, and long-term care providers), while the rest would be spread across other sectors of the economy, especially food-related sectors.19

The loss of 1.22 million jobs lost is roughly equivalent to a 0.8-percentage-point increase in the U.S. unemployment rate. About 7.2 million people were unemployed in May 2025 (4.2%). The impact of the Medicaid and SNAP cutbacks is comparable to increasing the national unemployment rate by one-sixth.

The total impact of the program cutbacks related to the House budget reconciliation bill would be even larger. In a previous brief, we noted that the expiration of the ACA’s enhanced premium tax credits in 2026 would lead to the loss of some 300,000 jobs.20 Other changes to the ACA marketplace would lead to further job losses too. In addition, the increase in the federal budget deficit due to the legislation could trigger “sequestration” that could require another $500 billion reduction in Medicare funding.21 These will cause additional job losses, particularly in health care.

The income lost by businesses and individuals would lead to $12.2 billion in reduced state and local tax revenues in 2029. These revenue losses would make it harder for state and local governments to balance their budgets, jeopardizing funding for education, infrastructure, and other state and local public services. The House budget reconciliation bill places additional fiscal burdens on states with such policies as the required state match for SNAP funding and limitations on health care provider taxes, which would put further fiscal pressure on state and local governments.

All States Will Lose, Some More Than Others

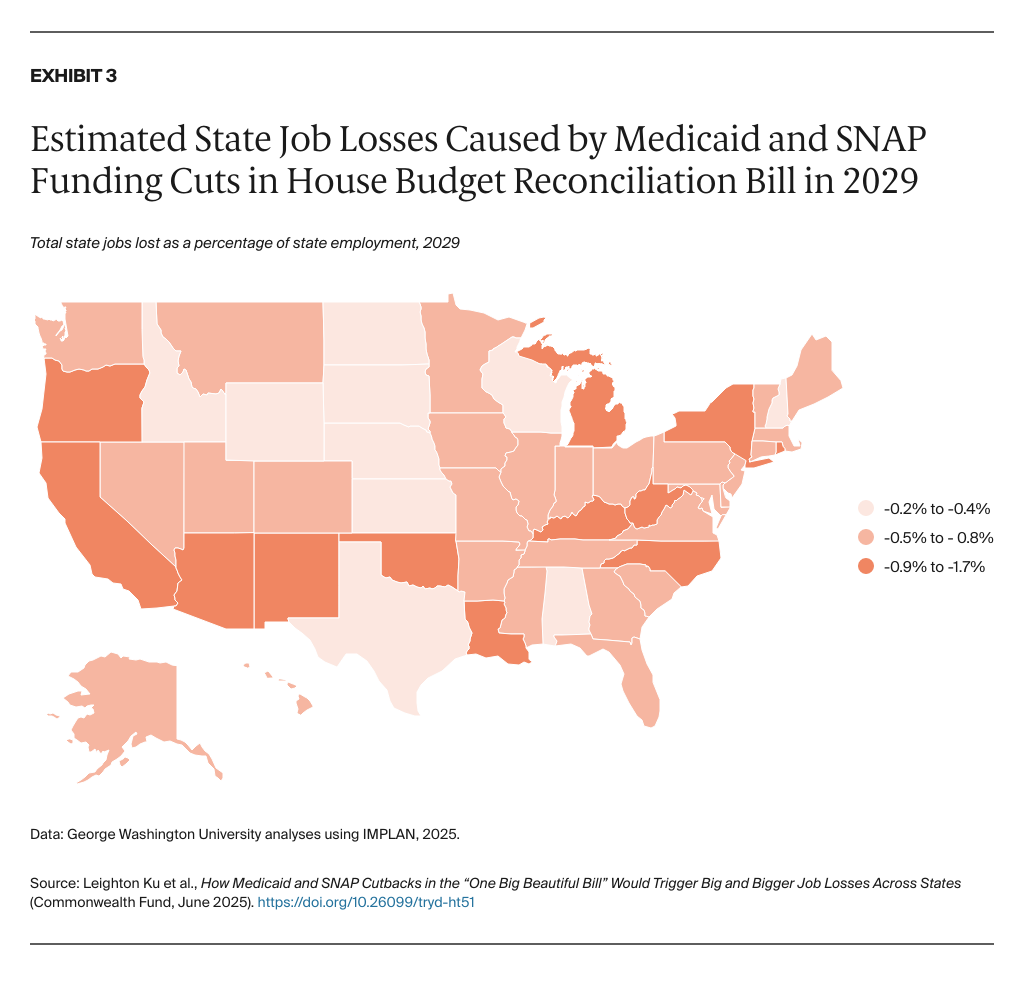
Since the Republican budget reconciliation bill is designed to target some states more than others, the economic consequences differ from state to state. Exhibit 3 shows the total jobs lost resulting from the combined Medicaid and SNAP cuts. Although the overall job loss (1.22 million) is equivalent to a 0.8-percentage-point increase in the national unemployment rate, losses are much higher in many states. (Exhibit 3 shows the decrease in the percentage of state employment in each state. More detailed data are shown in Appendix Table 3.)

All states will lose jobs. New Mexico is projected to have the largest percentage-point increase in unemployment, 1.7, while Wyoming will have the smallest, 0.2. The impact of the bill will vary ninefold across the states.

Ku_medicaid_snap_cutbacks_OBBB_job_losses_Exhibit_03

Since states with relatively more low-income families rely more heavily on Medicaid and SNAP, the cutbacks will hit economically fragile states harder. Cutting the two programs inevitably means that poorer states and communities will experience the greatest harm. For example, the average job loss in the five states with the highest poverty rates (Louisiana, Mississippi, New Mexico, West Virginia, and Kentucky) is 1.3 percentage points, but it’s 0.6 percentage points for the five states with the lowest poverty rates (New Hampshire, Utah, Minnesota, Colorado, and Maryland). Some of the differences are also partly related to specific provisions of the legislation, such as Medicaid work requirements or SNAP state match policies.

States with the highest relative job losses include: New Mexico (−1.7% of state employment), Arizona (−1.4%), Kentucky (−1.4%), and Louisiana (−1.3%). States with the most job losses include: California (−181,000), New York (−114,200), Texas (−62,200), and Pennsylvania (−50,900).

The budget reconciliation bill will also have differential effects on state GDPs, as well as on state and local tax revenues (Appendix Table 3). More difficult to assess is the extent to which the House bill will change Medicaid or SNAP participation levels in each state. The Urban Institute has estimated the participation effects of Medicaid and SNAP work requirements.22

Discussion

The congressional architects of the budget reconciliation bill believe they are eliminating fraud and waste while protecting the vulnerable. Rep. Brett Guthrie (R–Ky.), chair of the House Committee on Energy and Commerce, said the bill “preserves and strengthens Medicaid for children, mothers, people with disabilities and the elderly — for whom the program was designed.”23 Rep. Glenn Thompson (R–Pa.), chair of the House Committee on Agriculture, stated there would be “absolutely no reductions in nutritional benefits.”24 However, CBO estimates of 10.9 million individuals losing insurance coverage (including 1.3 million people dually eligible for Medicaid and Medicare who would lose Medicaid coverage of Medicare costs) and 5 million losing SNAP show that there is substantial harm to vulnerable beneficiaries, including children, people with disabilities, and elderly adults. Millions more could be harmed by the changes states will ultimately have to make to compensate for the loss of federal funding.

Our study reveals another, less discussed consequence of the budget cutbacks: the damage to state economies and loss of hundreds of billions of dollars, amounts that greatly exceed any federal savings. More than a million people will lose their jobs, particularly in the health care sector. Hospitals, clinics, and nursing homes will close, many of them in rural and low-income communities.25 The need to compensate for the loss of billions of dollars in federal funding will mean that state and local governments will have to consider cuts in other public services, such as education or infrastructure, just as they lose billions of dollars in state and local tax revenue because of the economic dislocation these policies cause.

Some of the most controversial elements of the legislation are the harsh work requirements mandated in Medicaid and toughened for SNAP. These would lead to 5 million to 6 million people losing Medicaid26 and 3 million losing SNAP benefits.27 A large body of research and ample experience has shown that these policies do not significantly improve employment outcomes; rather, their primary impact is to greatly reduce the number of people helped by the programs.28 Moreover, the budget cuts will actually cause more than a million people to lose employment.

Finally, economic disparities between states — regardless of whether they’re red or blue — will also deepen. Because states with a greater number of poor families rely more on Medicaid and SNAP, these states will suffer the most severe economic losses.


How We Conducted This Study

Estimating State-Level Federal Funding Changes

An important element of this analysis is estimating changes in federal funding for each state in 2029, based on the many sections of the bill. We began by estimating state “baseline” benefit federal funding levels for each state, using state estimates of Medicaid expenditures for fiscal year 2025 and actual Supplemental Nutrition Assistance Program (SNAP) expenditures for fiscal year 2024. These were then inflated to 2029 levels, based on the Congressional Budget Office’s baselines, using data and methods we described previously.29

To estimate the state-level funding effects, we relied on the CBO’s estimates of the national impact of the One Big Beautiful Bill Act that was passed by the U.S. House of Representatives.30

We then allocated state-level estimates of the bill’s provisions, based on CBO scoring of outlays for the different sections of the bill and recent data indicating the relative impact of the varying sections of the bill. The allocation of Medicaid provisions was based on key aspects of the bill:

  • Work requirements and related provisions like cost sharing that affect states serving expansion populations, based largely on Urban Institute data.31
  • Prohibition on bonus funding for states that have not expanded Medicaid eligibility, allocated proportionately across these 10 states.
  • Reductions of federal expansion funding for states that serve undocumented immigrants.32
  • The cap on Medicaid provider taxes, based on the Hilltop Institute’s estimates of the value of existing provider taxes.33
  • Limitations on Medicaid state-directed payments, based on analyses of public information documents shared by Manatt Health.34
  • All other provisions that were assumed to affect all states proportionate to the level of their Medicaid expenditures (this includes prohibitions of regulations related to eligibility and enrollment and on nursing home staffing). This allocation also accounts for budgetary “interaction effects” of the provisions.

Some provisions of the bill are related to future policy decisions that could be made by states in the absence of the bill, such as how much states might increase provider taxes, which states might drop or add state-funded coverage of undocumented immigrants, or which states might drop or add expansions of Medicaid eligibility for low-income adults. Based on the most recent information available to us, we allocated the funding impact of these policies proportionately across the applicable states in a way that approximates a “current services” baseline assessment. We acknowledge, however, that this introduces uncertainty in our estimates, since states may alter their policy choices and modify the impact before 2029.

The allocation of state-level SNAP funding effects was conducted in a similar fashion. At the national level, we aligned with the CBO’s May 20 estimates of the impact of SNAP-related provisions of the bill. We allocated state-level changes based on three key aspects of the bill: 1) state match requirements based on the most recent payment error rates, reported for fiscal year 2023;35 2) expansion of SNAP work requirements;36 and 3) all other provisions, which we allocated proportionate to state SNAP benefit expenditures; this also includes adjustments for budgetary interaction effects.

Future SNAP payment error rates may differ from the FY 2023 levels. The rates can change each year,37 but we deemed allocating the effects based on the most recent data to be the most reasonable approach. Analysis of the CBO estimates for this policy indicate CBO also expects high payment error rates to persist, leading to high average state match requirements.38

Estimating Economic, Employment, and Tax Impacts

Our estimates of the economic, employment, and tax effects of reduced federal funding are produced using IMPLAN, a widely used input–output economic impact software system.39 The underlying logic is that funding cutbacks have “multiplier effects” that are felt initially in the health care sector and food sectors but soon spread to other economic and employment sectors as well.

IMPLAN enables us to estimate three key impacts for states, their businesses and residents: 1) changes in state gross domestic products (GDPs) caused by the reduction in federal funding; 2) changes in the number of jobs in the state, which are categorized as direct (health or food), indirect (other sectors), and total employment; and 3) changes in state and local tax revenues caused by the changes in household and business incomes. The definitions of these metrics were described previously.40

For Medicaid, we partitioned each state’s Medicaid loss in four health care sectors: hospital, ambulatory care, pharmaceuticals, and long-term care, based on estimated Medicaid spending in these sectors.41 Our IMPLAN-based analysis of the cuts in SNAP funding was similar but focused on changes in food-related expenditures. As described in an earlier brief, since SNAP relies on the fact that households must blend SNAP benefits and their own income to purchase enough food, research shows that SNAP induces a marginal propensity to purchase more food. Thus, we allocated each state’s share of SNAP reductions in two parts: a 30 percent reduction in food purchases and a 70 percent reduction in other consumer goods purchased by low-income households.42

Both the Medicaid and SNAP analyses use IMPLAN’s Multi-Regional Input-Output (MRIO) methodology to account for cross-state effects of the policies (sometimes called “leakages”).43 For example, some of the food purchased in Georgia may have been grown in Kansas or processed in Tennessee, so lower grocery purchases in one state may cause losses in other states. A nurse who loses her job in a Louisiana clinic might reside in Texas; thus, a job lost in one state could create economic losses in another.

How the Multiplier Effect Works

The figure below illustrates how the multiplier effect works for Medicaid and SNAP. For Medicaid, the reduction in federal Medicaid funds lead to reductions in state Medicaid programs’ budgets. In turn, the loss of insurance coverage lowers revenue to health care providers, like hospitals, clinics, pharmacies and nursing homes. These are the direct effects.

AUTHOR_REVIEW_Ku_medicaid_snap_cutbacks_OBBB_job_losses_flowchart

In turn, health care providers must compensate for revenue losses by reducing how much they spend on staff and on goods and services from vendors (such as medical supplies, equipment, rent, and IT services). These businesses must also reduce spending on labor, goods, and services; the reductions in labor expenses means health providers and other businesses must lay off staff and reduce compensation. These are the indirect impacts of the policy change.

Finally, as employees lose income, they purchase fewer consumer goods and services (e.g., retail goods, transportation, groceries, rent). These are known as induced losses. Falling personal and business income also lowers state and local revenue from income, sales, and other taxes, such as real estate taxes.

These principles also apply to the loss of federal SNAP funding. Although SNAP is administered by state agencies and benefits are distributed to recipients, the SNAP funds actually flow directly to grocery stores for food purchases, although as described above, economists recognize that consumers redeploy their available household income to purchase other goods and services. Parallel to the Medicaid example, these effects can be viewed as direct, indirect, and induced effects.

Why Our Estimates Are Conservative

As discussed in earlier briefs, we focus on the effects of changes in federal funding because they are exogenous changes (“shocks”) in the resources available to each state and its residents, caused solely by the federal policy changes. States, businesses, or individuals may compensate for the reduction in federal funding by shifting resources away from other uses (e.g., raising taxes, cutting other services, or consumption), which have similar economic repercussions. Focusing on the federal budgetary changes makes our estimates more conservative. Also, some economic multiplier studies report the effects on “economic activity” (which may double-count losses in production, wholesale, and retail sectors), but we present estimates of changes in state GDPs, based on the value added (or lost) within a state, which are much more conservative and consistent with standard approaches for measuring state economies.

Medicaid and SNAP cutbacks could have other harmful effects on health, nutrition, and well-being. A large body of research has demonstrated how the expansion of Medicaid coverage under the ACA led to improved health access, better health, and greater financial and mental well-being.44 SNAP has also been associated with better health and lower financial strain.45 The loss of health and nutrition benefits could impair health or mental well-being, leading to additional losses in productivity or higher health care costs. Our analyses do not account for these other health and social costs; they are based entirely on the economic repercussions of federal funding reductions on state economies and employment.

Ku_medicaid_snap_cutbacks_OBBB_job_losses_Appendix_Table_01
Ku_medicaid_snap_cutbacks_OBBB_job_losses_Appendix_Table_02

Ku_medicaid_snap_cutbacks_OBBB_job_losses_Appendix_Table_03
NOTES
  1. The chairs of the Senate Agriculture and Finance committees have issued their proposals for changes in SNAP, Medicaid, and the Affordable Care Act marketplaces, but neither final disposition of a Senate version nor related budget estimates are known as of this writing.
  2. Congressional Budget Office, “Estimated Budgetary Effects of H.R. 1, the One Big Beautiful Bill Act,” June 4. 2025.
  3. Ben Leonard, “Trump Vows to ‘Love and Cherish’ Medicaid — While Republicans Plot Cuts for Savings,” Politico, Jan. 31, 2025.
  4. Jason Bogage et al., “House Approves Trump’s Massive Tax and Immigration Package,” Washington Post, updated May 22, 2023.
  5. Philip Swagel, Congressional Budget Office, “Estimated Effects on the Number of Uninsured People in 2034 Resulting from Policies Incorporated Within CBO’s Baseline Projections and H.R. 1, the One Big Beautiful Bill Act,” letter to Sen. Wyden and Reps. Pallone and Neal, June 4, 2025.
  6. Philip Swagel, Congressional Budget Office, “Potential Effects on the Supplemental Nutrition Assistance Program of Reconciliation Recommendations Pursuant to H. Con. Res. 14, as Ordered Reported by the House Committee on Agriculture on May 12, 2025,” letter to Sen. Klobuchar and Rep. Craig, May 22, 2025.
  7. Drew Altman, “The Spotlight Is on Medicaid Cuts, But the ACA Marketplaces Could See a One-Third Cut in Enrollment,” KFF, May 20, 2025.
  8. Philip Swagel, Congressional Budget Office, “Potential Statutory Pay-As-You-Go Effects of a Bill to Provide Reconciliation Pursuant to H. Con. Res. 14, the One Big Beautiful Bill Act,” letter to Rep. Boyle, May 20, 2025.
  9. Philip Swagel, Congressional Budget Office, “Preliminary Analysis of the Distributional Effects of the One Big Beautiful Bill Act,” letter to Reps. Boyle and Jeffries, May 20, 2025; and Philip Swagel, Congressional Budget Office, “Debt-Service Effects Derived From H.R. 1, the One Big Beautiful Bill Act,” letter to Sen. Merkley, June 5, 2025.
  10. Leighton Ku et al., How Potential Federal Cuts to Medicaid and SNAP Could Trigger the Loss of a Million-Plus Jobs, Reduced Economic Activity, and Less State Revenue (Commonwealth Fund. Mar. 2025); and Data Tables (Commonwealth Fund, Mar. 2025).
  11. KFF, “Health Provisions in the 2025 Federal Budget Reconciliation Bill,” updated May 22, 2025; and Edwin Park, Medicaid and CHIP Cuts in the House-Passed Reconciliation Bill Explained (Georgetown Center on Children and Families, May 27, 2025; updated June 4, 2025.
  12. U.S. House of Representatives, Committee on Agriculture, “Section-by-Section of House Agriculture Committee Budget Reconciliation Bill,” May 12, 2025.
  13. There is a small discrepancy in estimates of SNAP cuts as a percentage of the baseline. At the national level, we use CBO’s national baseline from January 2025, which includes both benefit and administrative costs. For state estimates, we used actual state benefit expenditures from 2024 and inflated them to 2029 levels, using CBO’s baseline, but state-level administrative cost data were not available, so they are not included.
  14. States with higher payment error rates lose more federal funding, although payment error rates can change from year to year. In 2023, the most recent data available, 26 states had error rates that would trigger a 25 percent match, and only seven would qualify for the lowest 5 percent rate. Some believe that the policy could lead to reductions in error rates, although the federal government already assesses financial penalties against states with high error rates and recoups overpayments from participants. The House bill will actually make it harder to improve error rates, as it lowers the error “tolerance level” to zero and cuts federal funding for administrative costs from 50 percent to 25 percent. A June 12 draft of the Senate Agriculture Committee’s version of the SNAP changes the state match provision to not apply to states with error rates below 6 percent and to set the maximum match rate to 15 percent of SNAP benefits for states with error rates above 10 percent. See Senate Agriculture, Nutrition, and Forestry Committee, “Section-by-Section,” June 12, 2025.
  15. Joint Economic Committee Minority, “State-by-State Data — 13.7 Million People Would Lose Health Insurance from Medicaid, ACA Cuts,” May 2025.
  16. Elizabeth Williams et al., Eliminating the Medicaid Expansion Federal Match Rate: State-by-State Estimates (KFF, Feb. 2025).
  17. Alison Barkoff and Leighton Ku, “House SNAP Cuts Would Further Endanger Medicaid for Disabled People, Older Adults,” Health Affairs Forefront (blog), June 3, 2025; Jessica Schubel et al., “History Repeats? Faced with Medicaid Cuts, States Reduced Support for Older Adults and Disabled People,” Health Affairs Forefront (blog), Apr. 16, 2025; Sara Rosenbaum et al., “Deep Medicaid Spending Cuts Put Health Care Coverage at Risk for One of Five Enrolled Children,” To the Point (blog), Commonwealth Fund, May 5, 2025; and Akeiisa Coleman and Avni Gupta, “How State Budget Shortfalls Could Put Medicaid Dental Coverage at Risk” (explainer), Commonwealth Fund, June 12, 2025.
  18. See https://implan.com/ for more about the IMPLAN system.
  19. Kyle Ross and Kennedy Andara, “SNAP Cuts Are Likely to Harm More Than 27,000 Retailers Nationwide,” Center for American Progress, May 8, 2025.
  20. Leighton Ku et al., The Cost of Eliminating the Enhanced Premium Tax Credits: Economic, Employment, and Tax Consequences (Commonwealth Fund. Mar. 2025).
  21. Philip Swagel, Congressional Budget Office, “Potential Statutory Pay-As-You-Go Effects of a Bill to Provide Reconciliation Pursuant to H. Con. Res. 14, the One Big Beautiful Bill Act,” letter to Rep. Boyle, May 20, 2025.
  22. Michael Karpman, Jennifer M. Haley, and Genevieve Kenney, Expanding Federal Work Requirements for Medicaid Expansion Coverage to Age 64 Would Increase Coverage Losses (Urban Institute, Apr. 2025); and Laura Wheaton and Linda Giannarelli, Expanded SNAP Work Requirements Would Reduce Benefits for Millions of Families (Urban Institute, May 2025).
  23. Brett Guthrie, “A Common Sense Budget Reconciliation Bill,” Wall Street Journal, May 11, 2025.
  24. John Cole, “Q&A: Congressman Glenn Thompson Talks Tariffs, SNAP, and Immigration’s Impact on Agriculture,” Pennsylvania Capital-Star, Mar. 13, 2025.
  25. Mitchell H. Katz, “Effect of Medicaid Cuts on the Medical Care Ecosystem,” JAMA, published online May 28, 2025.
  26. Michael Karpman, Jennifer M. Haley, and Genevieve Kenney, Expanding Federal Work Requirements for Medicaid Expansion Coverage to Age 64 Would Increase Coverage Losses (Urban Institute, Apr. 2025).
  27. Philip Swagel, Congressional Budget Office, “Potential Effects on the Supplemental Nutrition Assistance Program of Reconciliation Recommendations Pursuant to H. Con. Res. 14, as Ordered Reported by the House Committee on Agriculture on May 12, 2025,” letter to Sen. Klobuchar and Rep. Craig, May 22, 2025.
  28. Congressional Budget Office, Work Requirements and Work Supports for Recipients of Means-Tested Benefits (CBO, June 2022); and Leighton Ku et al., How National Medicaid Work Requirements Would Lead to Large-Scale Job Losses, Harm State Economies, and Strain Budgets (Commonwealth Fund, May 2025).
  29. Leighton Ku et al., How Potential Federal Cuts to Medicaid and SNAP Could Trigger the Loss of a Million-Plus Jobs, Reduced Economic Activity, and Less State Revenue (Commonwealth Fund. Mar. 2025). State Medicaid expenditures for FY 2025 were based on state estimates in CMS-37 reports, while state SNAP expenditures are based on USDA reports for FY 2024. These were inflated to FY 2029 levels, assuming growth rates projected by the CBO.
  30. Congressional Budget Office, “Estimated Budgetary Effects of H.R. 1, the One Big Beautiful Bill Act,” June 4. 2025.
  31. Michael Karpman, Jennifer M. Haley, and Genevieve Kenney, Expanding Federal Work Requirements for Medicaid Expansion Coverage to Age 64 Would Increase Coverage Losses (Urban Institute, Apr. 2025).
  32. Elizabeth Williams et al., Proposed Medicaid Federal Match Penalty for States that Have Expanded Coverage for Immigrants: State-by-State Estimates (KFF, May 2025).
  33. Morgan Henderson, Leigh Goetschius, and Alice Middleton, What’s the Impact of Eliminating Medicaid Provider Taxes? (Hilltop Institute. May 2025).
  34. Personal communication, Manatt Health, June 2025.
  35. Food and Nutrition Service, “SNAP Payment Error Rates,” U.S. Department of Agriculture, last updated, July 9, 2024.
  36. Katie Bergh, Catlin Nchako, and Luis Nuñez, “Expanded Work Requirements in House Republican Bill Would Take Away Food Assistance from Millions: State and Congressional District Estimates,” Center on Budget and Policy Priorities, May 13, 2025.
  37. Dottie Rosenbaum, Katie Bergh, and Wesley Tharpe, “Imposing SNAP Food Benefit Costs on States Would Worsen Hunger, Hurt States’ Ability to Meet Residents’ Needs,” Center on Budget and Policy Priorities, last updated Mar. 21, 2025.
  38. We note that: a) states already face fiscal penalties for high payment error rates and overpayments to households must be recouped; b) efforts to tighten eligibility and benefit assessment to lower overpayments may increase underpayments so the net impact on total error rates is mitigated; c) the bill tightens the error rate “tolerance level” from $57 (after adjustment for inflation) to $0, which will substantially increase measured error rates (both over- and underpayments); and d) the bill reduces federal funding for SNAP administrative costs from 50 percent to 25 percent, which will seriously limit states’ ability to improve eligibility determinations and monitoring. An underlying cause of payment errors is the high volatility of earnings among low-income workers, whose hours and wage rates may vary dramatically over time and who often have unsteady “gig work.” This unpredictability and instability inherently increase the risk of payment errors and also create risks related to work requirements for both SNAP and Medicaid. See Lauren Bauer, Chloe East, and Olivia Howard, Low-Income Workers Experience — by Far — the Most Earnings and Work Hours Instability (Brookings Institution, Jan. 2025).
  39. For further information on IMPLAN methodology and data sources, visit https://implan.com/. Economic and employment data used in this version of IMPLAN are based on 2023, the most recent data year available. But the estimates for these analyses were conducted for 2029, assuming general economic changes such as inflation. All estimates are compared to baseline scenarios in which current law policies remain in place. Even if actual economic circumstances change in future years, these estimates should continue to indicate the approximate direction and magnitude of effects of the Medicaid and SNAP budget cuts.
  40. Leighton Ku et al., How Potential Federal Cuts to Medicaid and SNAP Could Trigger the Loss of a Million-Plus Jobs, Reduced Economic Activity, and Less State Revenue (Commonwealth Fund. Mar. 2025).
  41. Centers for Medicare and Medicaid Services, “National Health Expenditures: Projected,” last updated Sept. 10, 2024.
  42. Leighton Ku et al., How Potential Federal Cuts to Medicaid and SNAP Could Trigger the Loss of a Million-Plus Jobs, Reduced Economic Activity, and Less State Revenue (Commonwealth Fund. Mar. 2025).
  43. Our model does not account for losses beyond U.S. borders. For example, about 15 percent of food purchased in the United States, particularly fresh fruits and vegetables, is imported from other countries, although U.S. food is also exported abroad. See Economic Research Service, “U.S. Food Imports,” U.S. Department of Agriculture, last updated Apr. 11, 2025.
  44. Laura Harker and Breanna Sharer, “Medicaid Expansion: Frequently Asked Questions,” Center on Budget and Policy Priorities, updated June 14, 2024.
  45. Steven Carlson and Joseph Llobrera, “SNAP Is Linked with Improved Health Outcomes and Lower Health Care Costs,” Center on Budget and Policy Priorities, Dec. 14, 2022; and Elizabeth Cox, Chloe East, and Isabelle Pula, “Beyond Hunger: The Role of SNAP in Alleviating Financial Strain for Low-Income Households,” Brookings Institution, June 20, 2024.

Publication Details

Date

Contact

Leighton Ku, Director, Center for Health Policy Research, Department of Health Policy and Management, Milken Institute School of Public Health, George Washington University

[email protected]

Citation

Leighton Ku et al., How Medicaid and SNAP Cutbacks in the “One Big Beautiful Bill” Would Trigger Big and Bigger Job Losses Across States (Commonwealth Fund, June 2025). https://doi.org/10.26099/tryd-ht51