With this year’s survey, the Commonwealth Fund introduces a new baseline. Historically, the Commonwealth Fund Biennial Health Insurance Survey was conducted exclusively using phone administration via stratified random-digit dial (RDD) phone sample. This year, however, we shifted to a hybrid sample design that utilized stratified address-based sample (ABS), combined with SSRS Opinion Panel, and prepaid cell phone sample. Other changes include expanding the survey to include all adults age 19 and older and making refinements to how we calculate poverty status and determine underinsurance for borderline cases. Collectively, these changes affect year-to-year differences in our trend questions. For that reason, this year’s brief does not report on trends.
The Commonwealth Fund Biennial Health Insurance Survey, 2022, was conducted by SSRS from March 28 through July 4, 2022. The survey consisted of telephone and online interviews in English and Spanish and was conducted among a random, nationally representative sample of 8,022 adults age 19 and older living in the continental United States. A combination of address-based, SSRS Opinion Panel, and prepaid cell phone samples were used to reach people. In all, 3,716 interviews were conducted online or on the phone via ABS, 3,656 were conducted online via the SSRS Opinion Panel, and 650 were conducted on prepaid cell phones.
The sample was designed to generalize to the U.S. adult population and to allow separate analyses of responses from low-income households. Statistical results were weighted in stages to compensate for sample designs and patterns of nonresponse that might bias results. The first stage involved applying a base weight to account for different selection probabilities and response rates across sample strata. In the second stage, sample demographics were poststratified to match population parameters. The data are weighted to the U.S. adult population by sex, age, education, geographic region, family size, race/ethnicity, population density, civic engagement, and frequency of internet use, using the 2019 and 2021 U.S. Census Bureau’s Current Population Survey (CPS), the 2015–2019 American Community Survey (ACS) 5-Year Estimates, and Pew Research Center’s 2021 National Public Opinion Reference Survey (NPORS).22
The resulting weighted sample is representative of the approximately 254 million U.S. adults age 19 and older. The survey has an overall maximum margin of sampling error of +/– 1.5 percentage points at the 95 percent confidence level. As estimates get further from 50 percent, the margin of sampling error decreases. The ABS portion of the survey achieved an 11.4 percent response rate, the SSRS Opinion Panel portion achieved a 2 percent response rate, and the prepaid cell portion achieved a 2.9 percent response rate.
This brief focuses on adults under age 65. The resulting weighted sample is representative of approximately 196.7 million U.S. adults ages 19 to 64. The survey has a maximum margin of sampling error of +/– 1.7 percentage points at the 95 percent confidence level for this age group.
Refinements to Poverty Status
A respondent’s household size and income are used to determine poverty status.
Previously, household size was determined by combining information about marital status and the presence of dependents under age 25 in the household, which resulted in a maximum possible household size of four persons. This year, we used a new survey question where respondents provided an open-ended numeric response. This allowed us to use the full U.S. Federal Poverty Guidelines up to 14 household members.
To create a fully populated income variable, we used hot deck imputation to populate income ranges for respondents that did not answer income questions. We then generated random exact incomes for each respondent. Respondent incomes within each income range were assumed to be uniformly distributed and were assigned using a standard increment between each income based on the size of the income range and the number of respondents with incomes in the range.
The more precise household size and random exact incomes were used to determine poverty status for all respondents according to the 2021 U.S. Federal Poverty Guidelines.
Refinements to Underinsurance Components
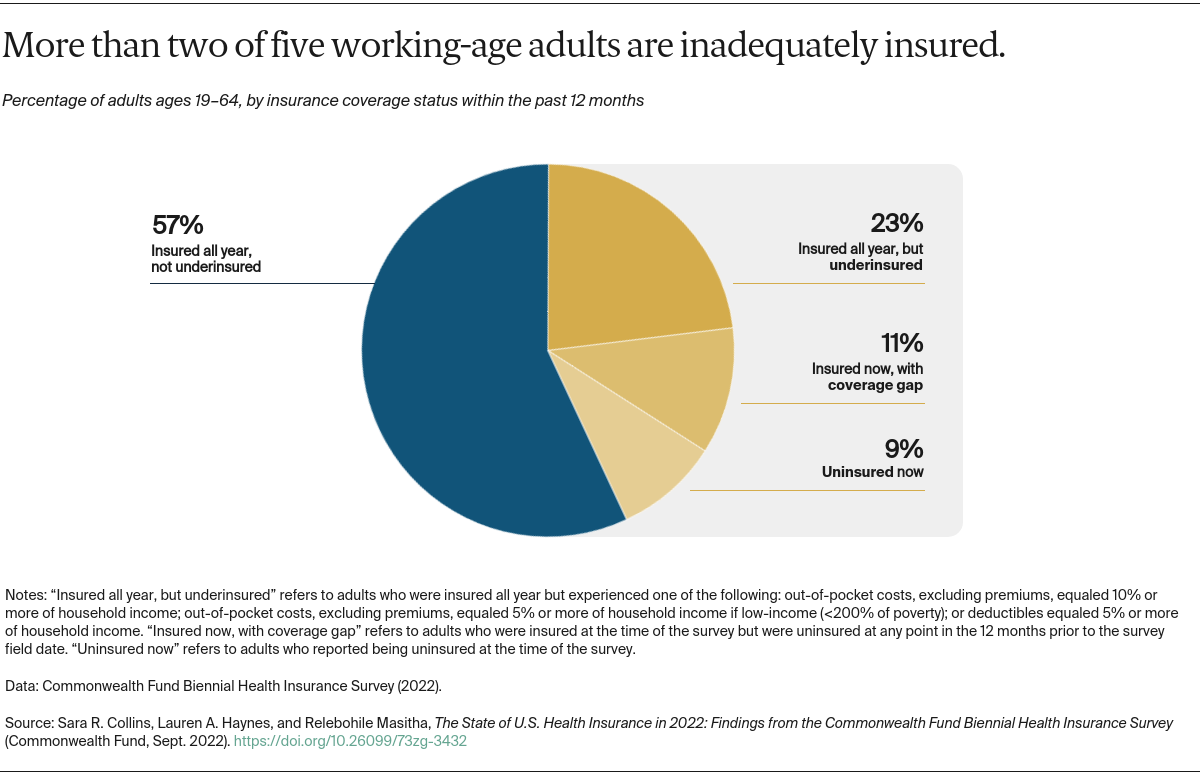
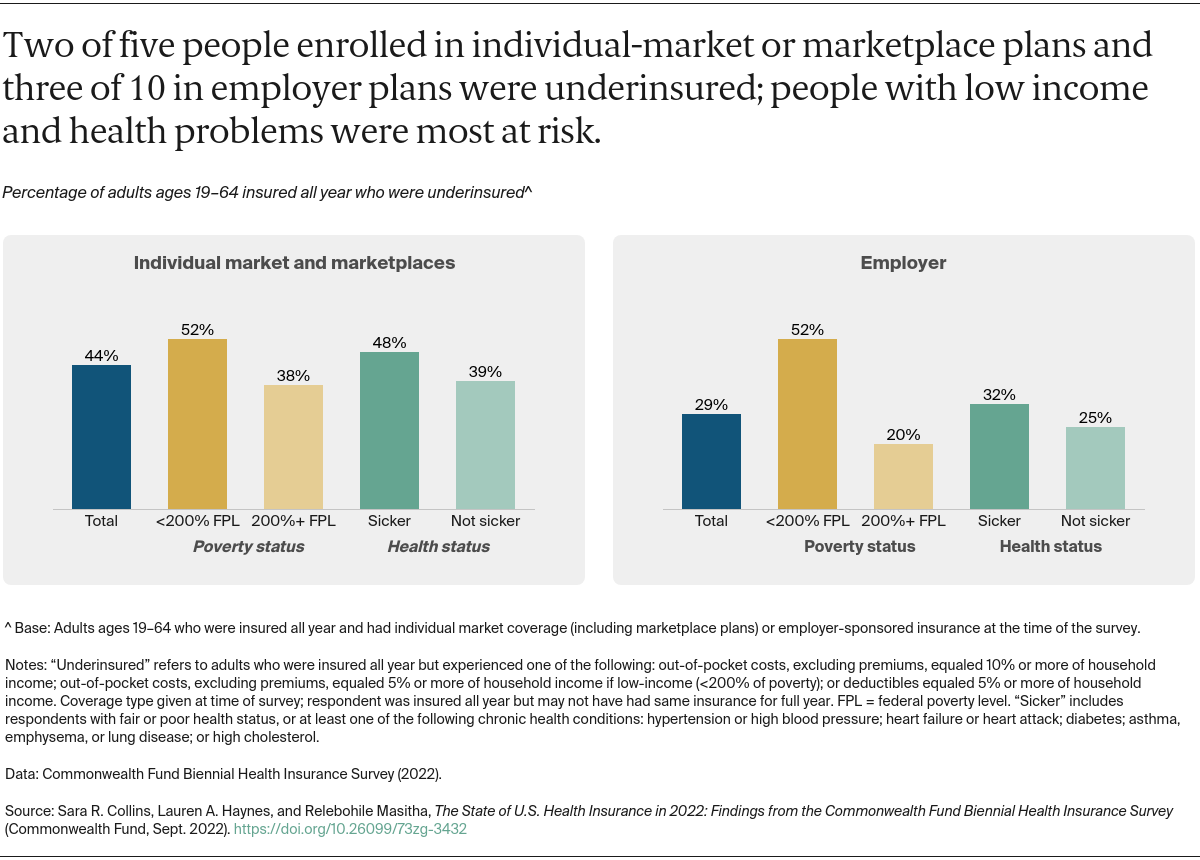
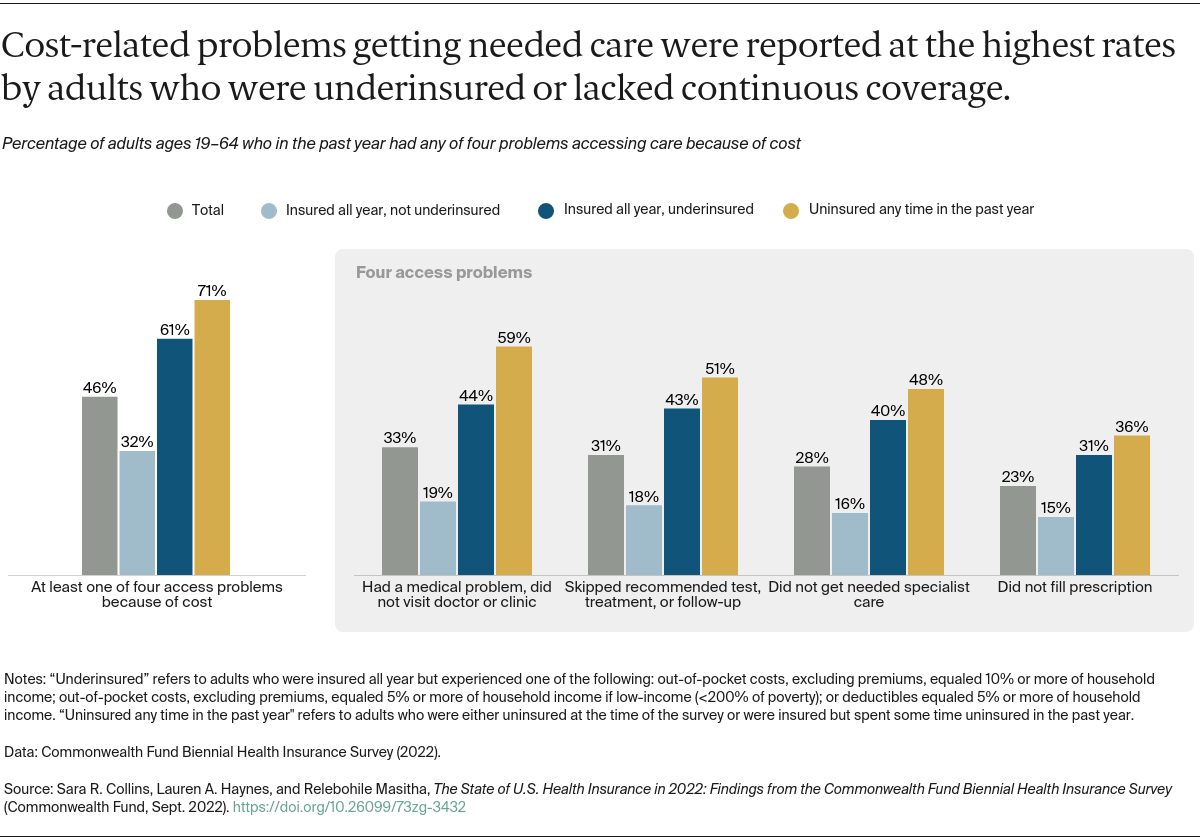
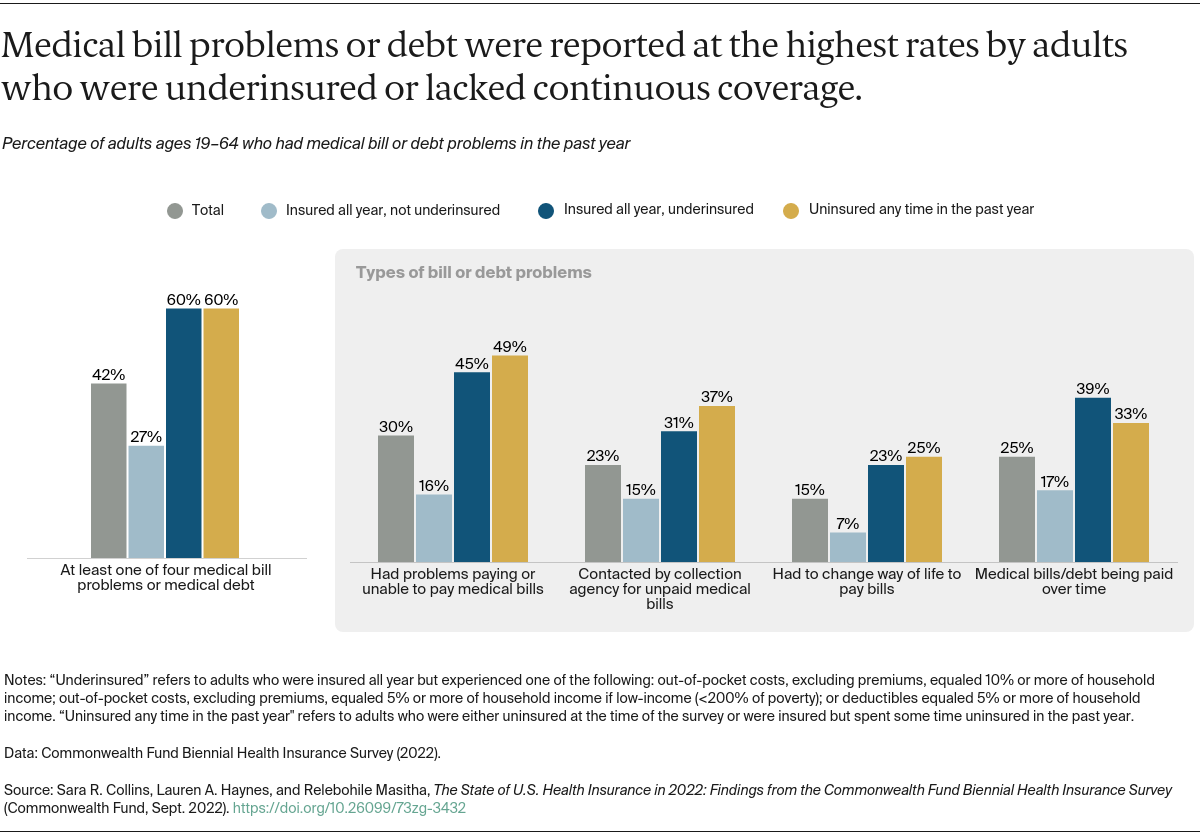
Underinsured adults are individuals who are insured all year but report at least one of three indicators of financial exposure relative to income: 1) out-of-pocket costs, excluding premiums, are equal to 10 percent or more of household income; or 2) out-pocket-costs, excluding premiums, are equal to 5 percent or more of household income (if living under 200 percent of the federal poverty level); or 3) their deductible is 5 percent or more of household income.
For each of the three underinsurance component measures, there are borderline cases for which the income ranges provided are too imprecise to categorize the respondent into “less than” or “more than” the stated underinsurance component. Previously, the Fund redistributed borderline cases for each component by conducting a 50/50 split into the “less than” and “more than” categories. This year we leveraged the imputed income ranges and random exact incomes generated to determine poverty status to categorize borderline cases.
Additionally, for those respondents who provided deductibles, we duplicated the methodology used to determine random exact incomes to compute random exact deductibles. These exact deductibles were compared to exact incomes to categorize borderline cases for the component of underinsurance that relates deductible to income.