In Memoriam
Our colleague and coauthor, Professor Joseph Cordes, a noted economist and a budget and tax expert, passed away in February 2026.

A barn stands past a road sign for a nearby hospital along a rural road outside Sandwich, Ill. Funding cuts and changes through H.R. 1 could reduce the capacity of hospitals and community health centers to provide care. Photo: Daniel Acker/Bloomberg via Getty Images
A barn stands past a road sign for a nearby hospital along a rural road outside Sandwich, Ill. Funding cuts and changes through H.R. 1 could reduce the capacity of hospitals and community health centers to provide care. Photo: Daniel Acker/Bloomberg via Getty Images
H.R. 1's rural health investment will be overshadowed by its cuts. By 2029, Medicaid and ACA funding reductions will shrink state economic activity by $197 billion and eliminate 1.65 million jobs nationwide
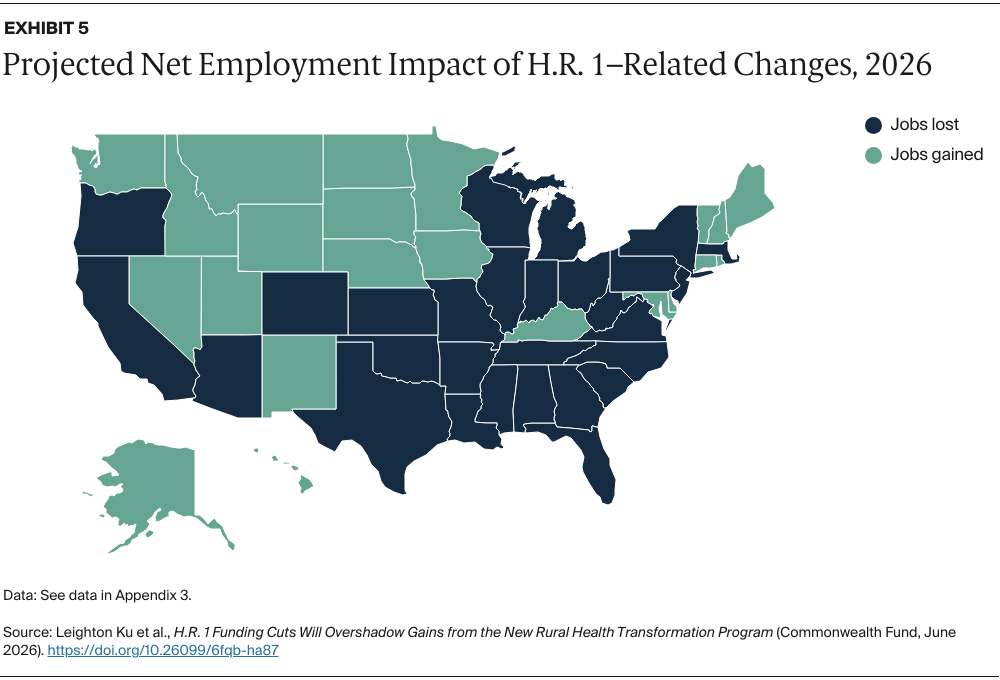
Every state will see net job and economic losses from H.R. 1's health cuts, regardless of Medicaid expansion status. In 2026 alone, 229,000 jobs are projected to disappear
H.R. 1's rural health investment will be overshadowed by its cuts. By 2029, Medicaid and ACA funding reductions will shrink state economic activity by $197 billion and eliminate 1.65 million jobs nationwide
Every state will see net job and economic losses from H.R. 1's health cuts, regardless of Medicaid expansion status. In 2026 alone, 229,000 jobs are projected to disappear
Our colleague and coauthor, Professor Joseph Cordes, a noted economist and a budget and tax expert, passed away in February 2026.
Issue: The 2025 budget reconciliation law (the One Big Beautiful Bill Act, or H.R. 1) reduces federal funding for Medicaid, Affordable Care Act (ACA) marketplaces, and the Supplemental Nutrition Assistance Program (SNAP) by about $1.3 trillion but adds $50 billion for the new Rural Health Transformation Program (RHTP). Additionally, the ACA enhanced premium tax credits expired on January 1, 2026.
Goal: To estimate the impact of H.R. 1 and the expiration of enhanced premium tax credits on state economies and employment levels, and state and local tax revenues in 2026, the first year of implementation, and 2029, when the legislation is fully implemented.
Methods: We estimate federal funding changes for the RHTP, ACA marketplaces, Medicaid, and SNAP, and use the IMPLAN modeling system to project economic and employment impacts.
Key Findings and Conclusions: We project that in 2026, the RHTP’s modest economic gains will be overshadowed by losses from budgetary cutbacks. The predicted combined national impact is 229,000 job losses, primarily affecting larger and more urban states. By 2029, 1.65 million jobs could be lost nationally, a 1.0 percentage point increase in the unemployment rate. Every state would experience substantial economic and employment losses, driven primarily by large Medicaid cuts.
The Rural Health Transformation Program (RHTP), which provides five years of federal funding to help states improve health care access and quality in rural areas, was created through the 2025 federal budget reconciliation law known as H.R. 1 or the One Big Beautiful Bill Act. The law also made sweeping cuts to Medicaid, Affordable Care Act (ACA) health insurance marketplaces, and the Supplemental Nutrition Assistance Program (SNAP).1 Although the net result is deep reductions in health and nutrition funding, the federal deficit will rise by over $3 trillion because of large tax cuts also included in the law.2 H.R. 1 is expected to cause more than 10 million Americans to lose their health insurance due to the ACA and Medicaid reductions, 3 million people to lose food assistance because of SNAP cutbacks, and a potential 51,000 preventable deaths due to Medicaid cuts.3 On January 1, 2026, months after H.R. 1 was signed into law, enhanced premium tax credits for the ACA marketplaces expired, causing ACA premiums to rise steeply and leading to rapid coverage losses.
This brief estimates the economic impacts of these sweeping changes to the health care landscape. Using the IMPLAN economic modeling system, we examine the combined effects of H.R. 1 and the expiration of the ACA tax credits on every state’s economy and employment in 2026, the first year of implementation, and 2029, when the law’s changes are fully implemented (see “How We Conducted This Study”). It builds on earlier briefs that have examined the potential economic effects of the U.S. House of Representatives version of the H.R. 1 legislation and the expiration of the ACA subsidies.4
The Congressional Budget Office (CBO) estimated that H.R. 1 will reduce federal Medicaid spending by more than $900 billion between the 2025 and 2034 fiscal years, while federal funding for the ACA marketplaces and SNAP will each be cut by almost $200 billion over the next decade. The RHTP adds $50 billion in funding over the decade.5 The expiration of ACA enhanced premium tax credits means federal funding is about $335 billion lower over a decade compared to if they were extended.6
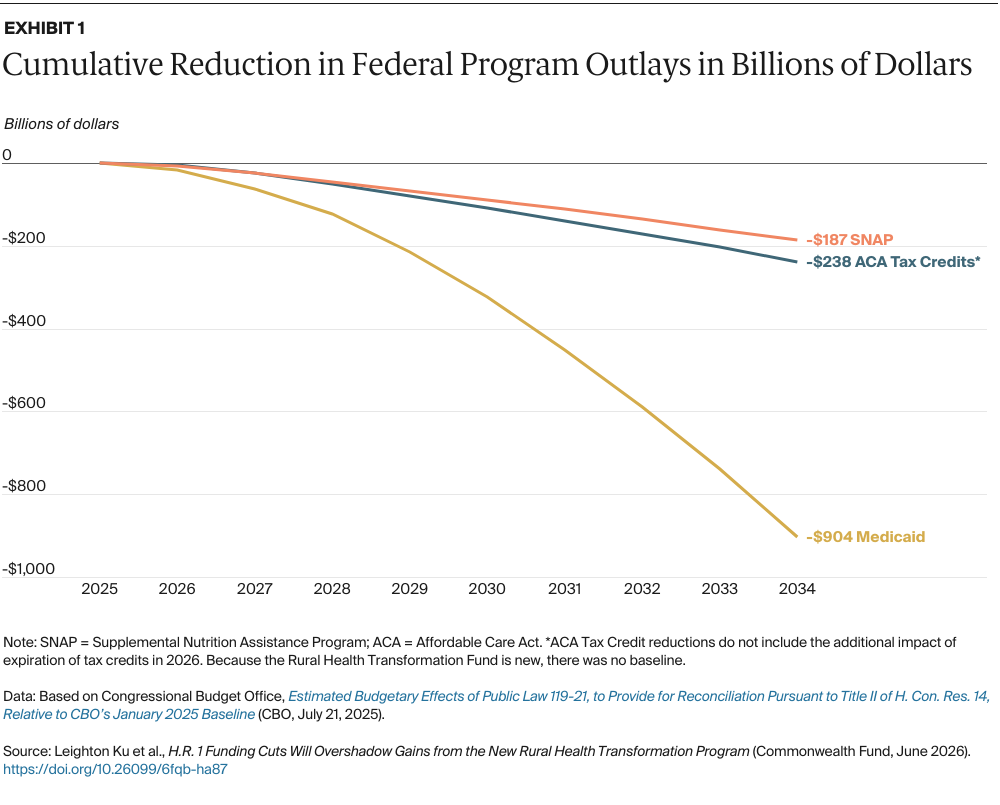
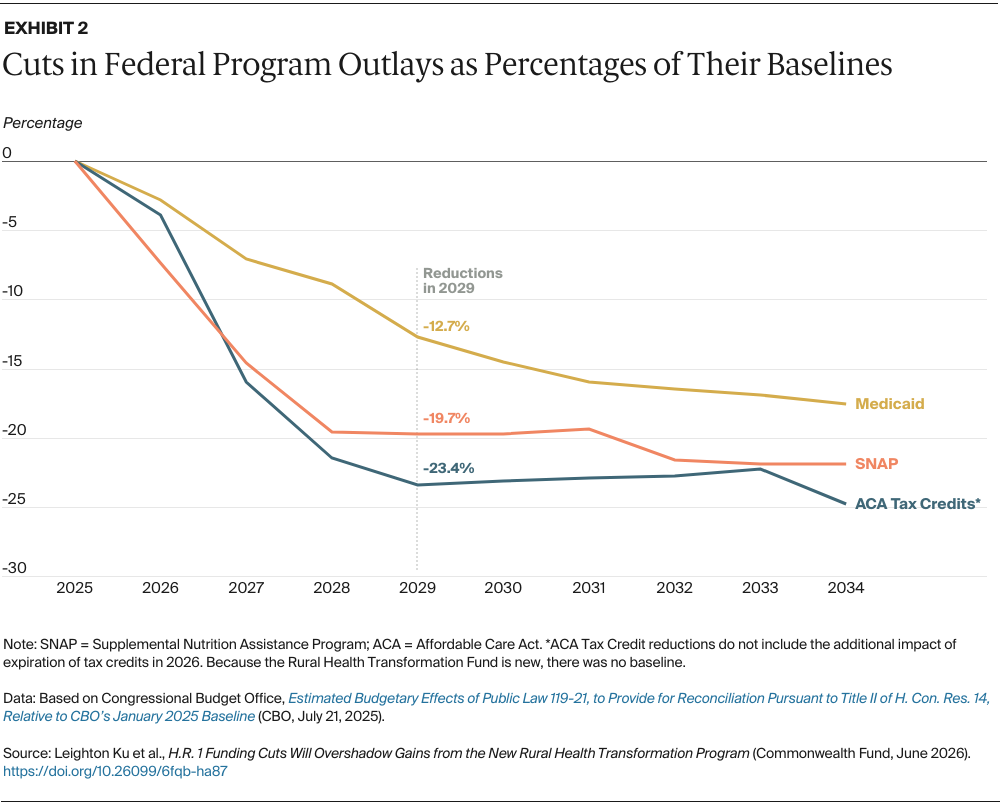
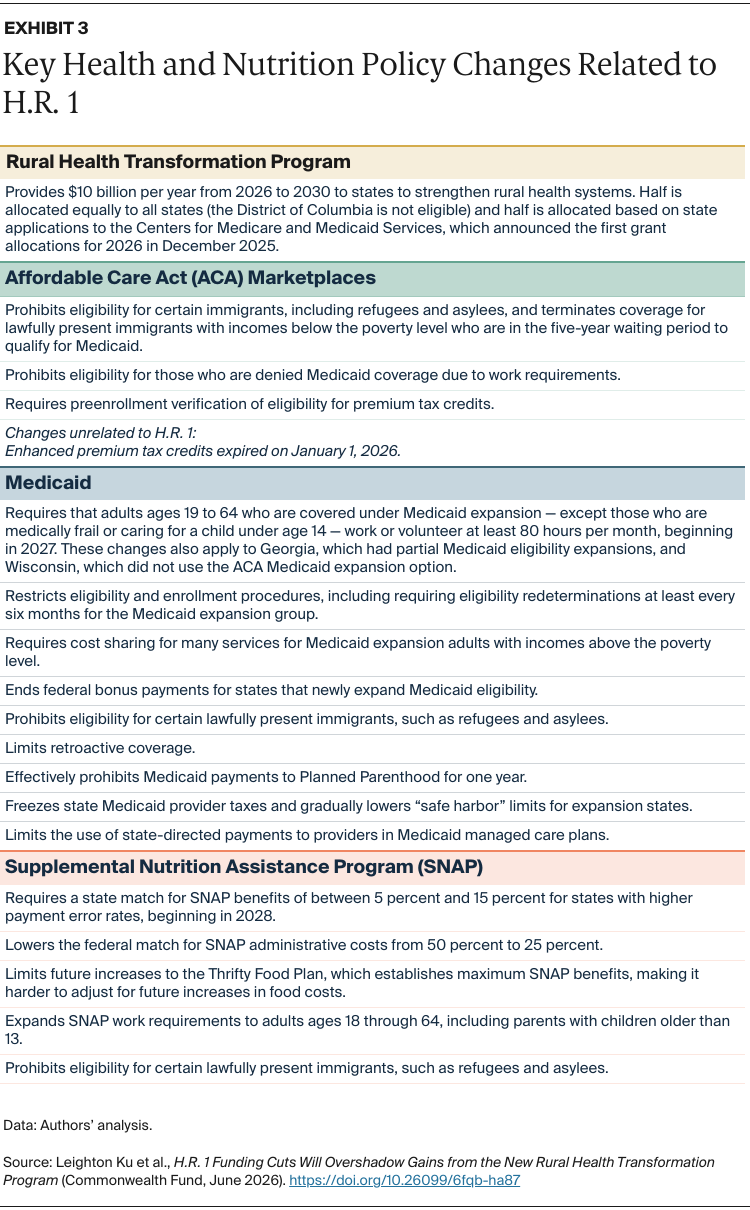
H.R. 1 changes are phased in, as illustrated in cumulative dollar changes in Exhibit 1 and percentage changes in Exhibit 2. While the RHTP began on January 1, 2026, alongside the expiration of ACA tax credits, Medicaid and SNAP cuts will largely be implemented later. By 2034, cumulative federal Medicaid reductions will total $904 billion, exceeding cumulative reductions in ACA marketplace and SNAP outlays. However, although the dollar amounts lost from Medicaid are much greater, the ACA marketplace and SNAP cuts are deeper when measured as a percentage of their annual baseline expenditures. In 2029, for example, federal Medicaid funding will be cut by 12.7 percent, while ACA marketplace funding will fall by 23.4 percent and SNAP funding by 19.7 percent. Additional losses from the expiration of the ACA enhanced premium tax credits means the combined impacts on the ACA marketplaces are even larger than shown in the exhibit. Key policies changes are summarized in Exhibit 3.
In 2026, we project the RHTP launch and the expiration of ACA tax credits — both beginning in January of this year — to have a largely net negative impact on state economies, jobs, and tax revenues.
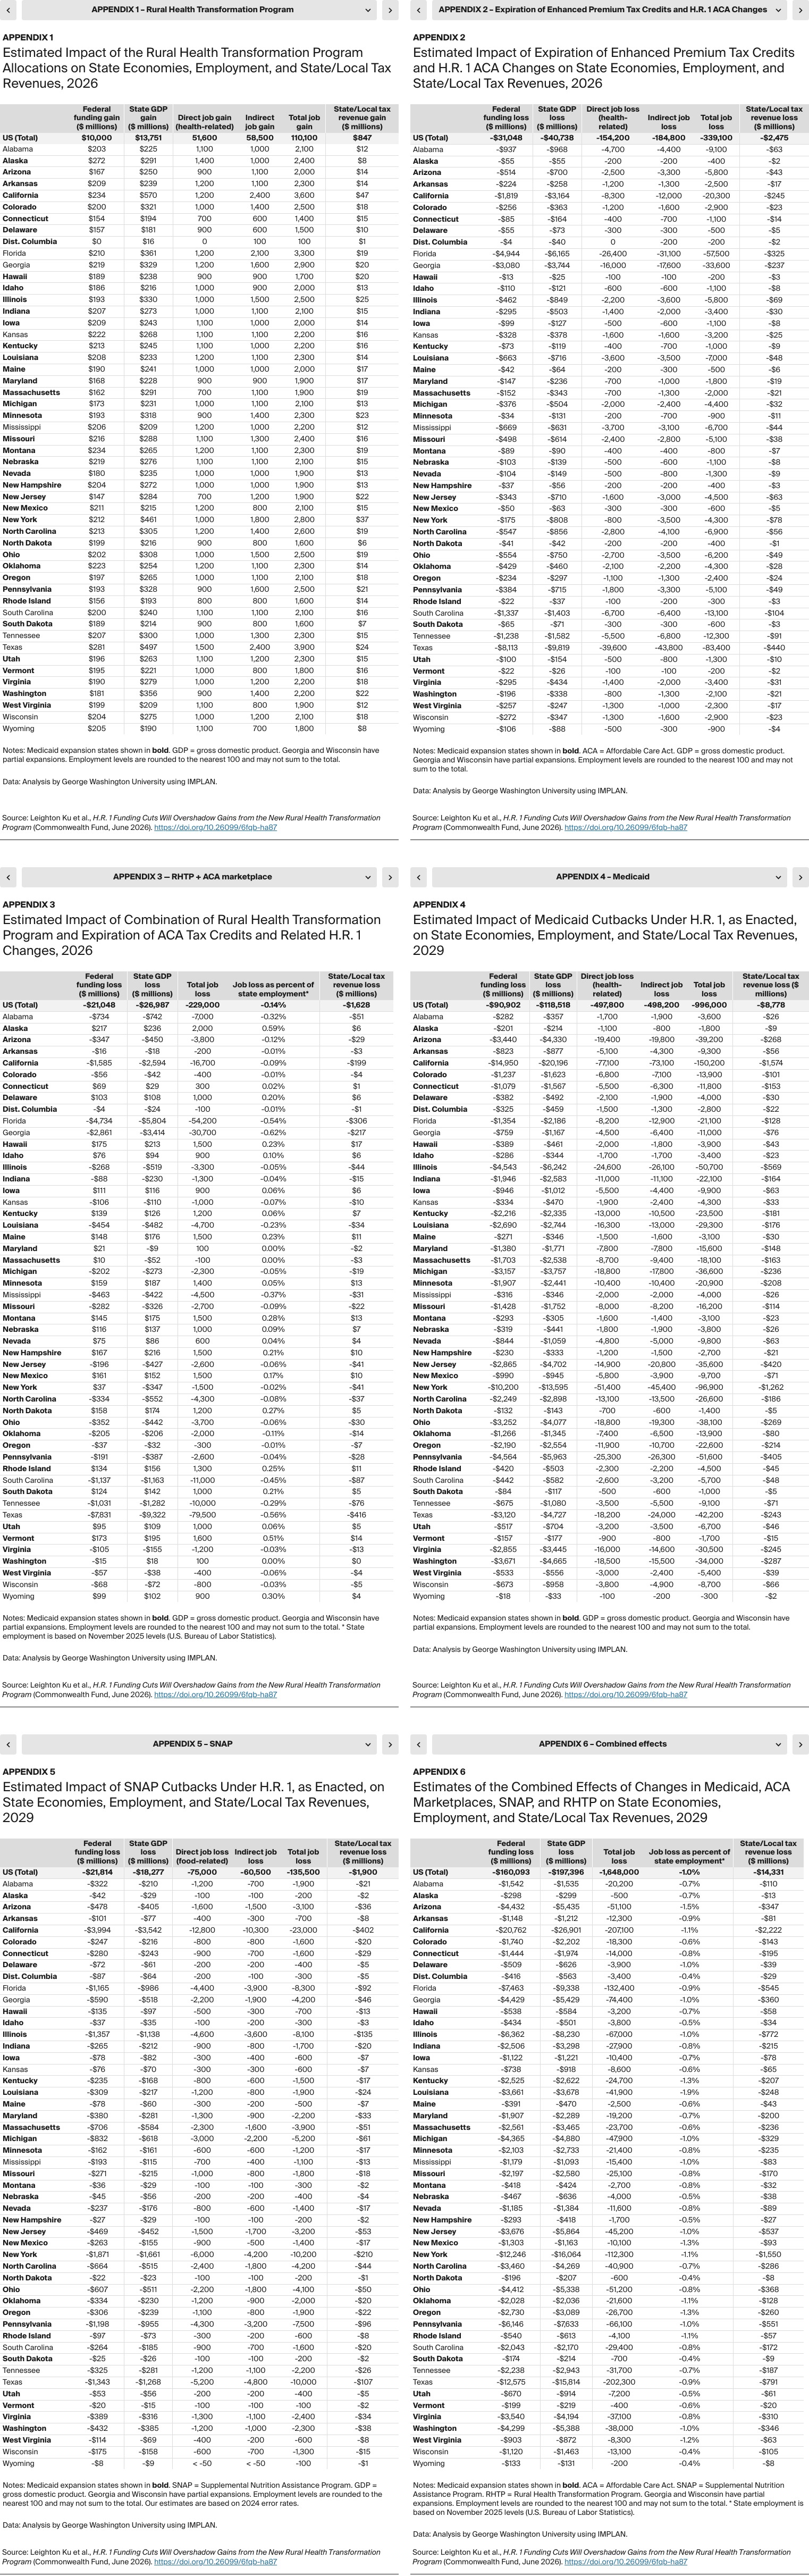
Rural Health Transformation Program. Ten billion dollars in RHTP funds have been distributed across 50 states, ranging from $281 million and $272 million for Texas and Alaska to $147 million for New Jersey. State economies, as measured by their gross domestic product (GDP), will be $13.8 billion higher as a result (see Appendix 1). The number of new jobs across the country will likely rise by 110,100, of which 51,600 are health-related, and economic gains will contribute to $847 million in additional state and local tax revenues. Relative gains will be higher in smaller rural states.
ACA health insurance marketplace. In 2026, the expiration of the enhanced premium tax credits and other H.R. 1–related changes will see federal funding for the ACA marketplace fall by $31 billion. State GDPs will fall even more, by $40.7 billion (Appendix 2), while state and local tax revenues will fall by $2.5 billion. This will lead to the loss of 339,100 jobs, of which 154,200 are health-related. Southern states, which generally did not expand Medicaid eligibility, tend to be more reliant on the ACA marketplaces. For example, the ACA cuts will lead to 83,400 jobs lost in Texas and 57,500 in Florida, both nonexpansion states. In comparison, Medicaid expansion states California and Louisiana are expected to lose 20,300 and 7,000 jobs, respectively. Overall, the average expected job loss is approximately 2,800 in expansion states, compared with 22,300 in nonexpansion states.
One potential economic effect not captured in our analysis: those who continue to get coverage through the ACA marketplaces will have to pay hundreds or thousands of dollars more for coverage or shift to ACA plans with higher cost sharing, undermining their financial security and reducing spending power on other goods and services.7
While the infusion of $10 billion into state economies for rural health contributes to some economic growth, it is overshadowed by the $31 billion in federal funding cuts to ACA marketplaces.
Exhibit 4 presents combined national estimates for 2026, including the states with the largest employment losses and the largest employment gains. States with the greatest losses — Georgia, Texas, Florida, South Carolina, Mississippi, Alabama, Tennessee, and Louisiana — are Southern states that rely more on the ACA marketplace. Georgia, Texas, and Florida lose between 30,700 and 79,500 jobs, equivalent to a 0.5 percent to 0.6 percent decline in the employment rate. States with job losses also have substantial reductions in their GDP and state and local tax revenues. States with the largest job increases — Alaska, Vermont, Wyoming, Montana, North Dakota, Rhode Island, Hawaii, and Maine — gain 900 to 2,000 jobs each, equivalent to a 0.3 percent to 0.6 percent increase in the employment rate. States with job gains also will have GDP gains and increased state and local tax revenues (Appendix 3 shows detail for all states in 2026).
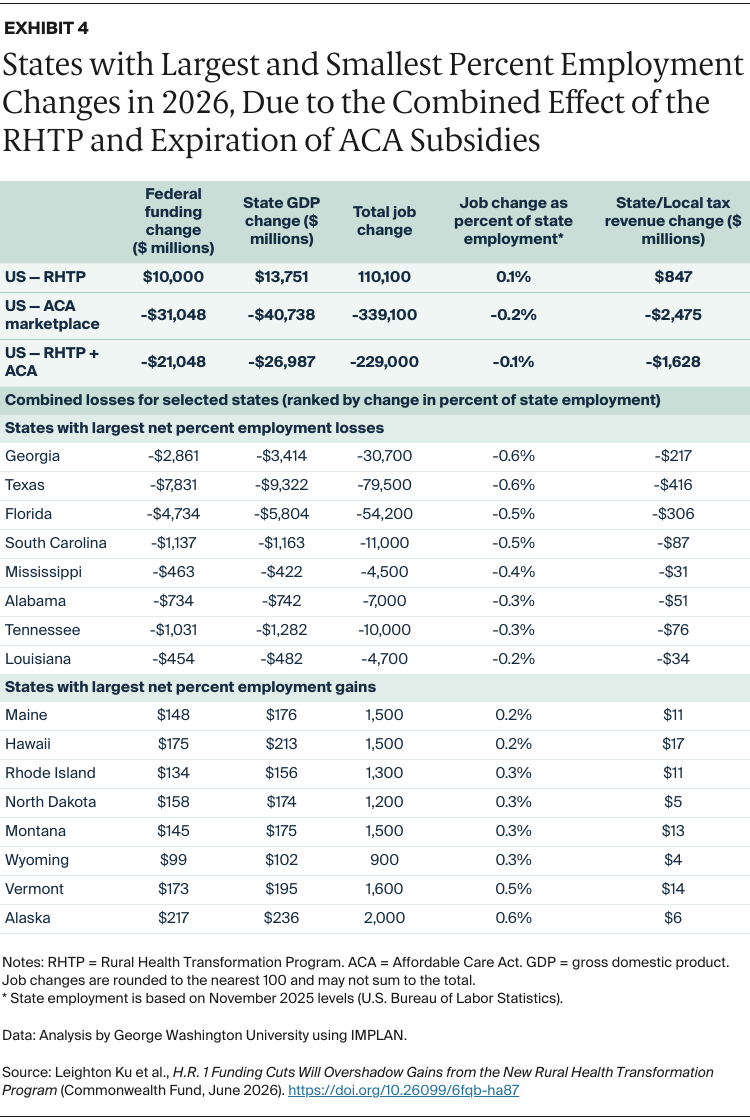
Exhibit 5 presents the national map of states gaining and losing jobs. Our analysis indicates that 22 smaller and rural states will have net positive gains and job growth, while the District of Columbia and 28 states, generally larger and more urban, will have net federal funding losses and lose jobs in 2026. Many of the states losing jobs are Southern states that did not expand Medicaid.
In 2029, when H.R. 1 provisions are fully implemented, we project that all states will lose federal funding and suffer substantial economic and employment losses.
Medicaid. In 2029, federal Medicaid funding will drop by $90.9 billion, causing state GDPs to fall by $118.5 billion (Appendix 4). Medicaid cuts also mean 996,000 fewer jobs nationwide in 2029, half of which will be health-related, including in hospitals, clinics, pharmacies, or nursing homes. States with the largest job losses include California, New York, Pennsylvania, Illinois, Texas, Arizona, Ohio, and Michigan, which lose between 150,200 and 36,600 jobs. States that expanded Medicaid eligibility under the ACA will likely face deeper losses because H.R. 1 targeted them with policies like Medicaid work requirements, restrictive enrollment procedures, and higher cost sharing only in expansion states. Individual and business income losses will cause state and local tax revenues to fall by $8.8 billion nationwide.
SNAP. Federal SNAP funding will be cut by $21.8 billion in 2029, causing state GDPs to decline by an estimated $18.3 billion (Appendix 5). The SNAP cutbacks will cause 135,500 jobs to be lost in 2029, of which about 75,000 are food-related jobs. Other research has examined SNAP’s importance in supporting revenues and jobs at grocery stores that feed all Americans.8 States with the greatest job losses due to the SNAP budget reductions include California, New York, Texas, Florida, Illinois, Pennsylvania, Michigan, Georgia, and North Carolina, which will lose between 23,000 and 4,200 jobs. Under H.R. 1, states with higher over- and underpayment error rates must pay 5 percent to 15 percent of SNAP benefit costs, leading to drastic reductions in federal payments. The expansion of SNAP work requirements and the halving of federal funding for administrative costs will likely make it harder for states to implement operational changes to lower their error rates.9 State and local tax revenues will decline by approximately $1.9 billion nationwide because of cuts to SNAP.
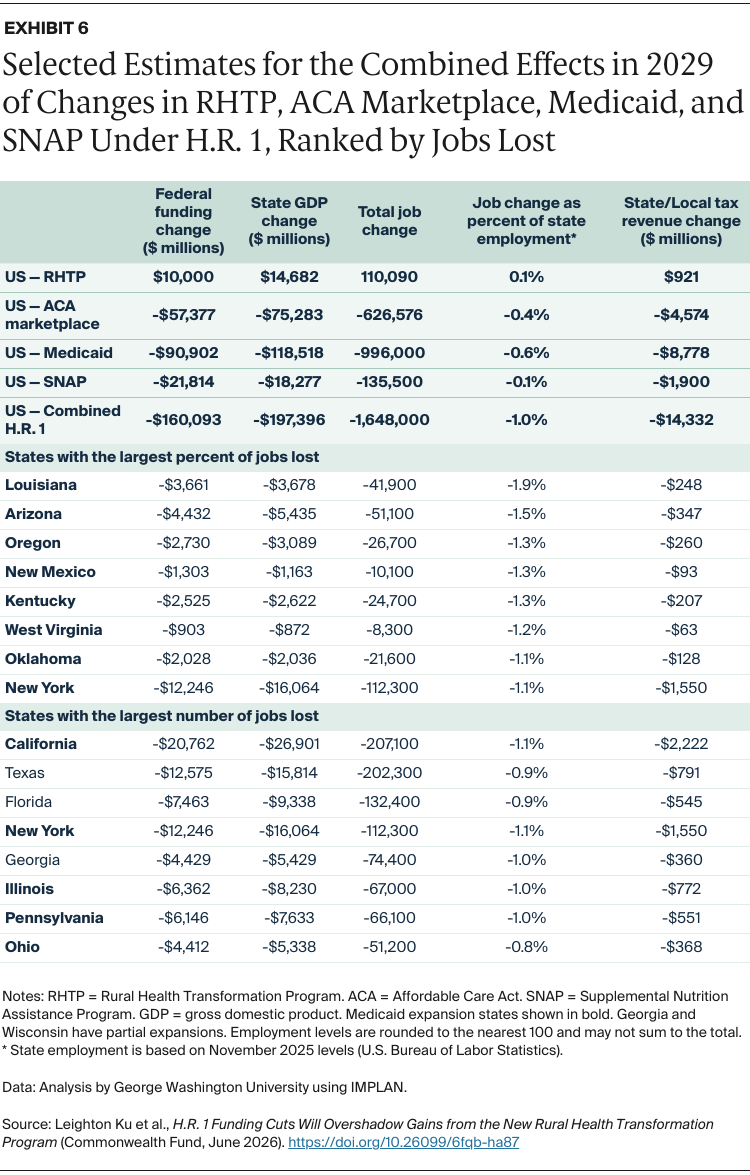
Exhibit 6 summarizes key results for the combined economic impact of the RHTP and ACA marketplace, Medicaid, and SNAP funding changes. In 2029, RHTP is expected to continue providing $10 billion in federal funding to states, but it will be eclipsed by ACA marketplace losses amounting to over $57 billion. Federal funding for Medicaid will drop by almost $91 billion and SNAP funding by almost $22 billion. Combined, these cuts will total $160 billion (Appendix 6 presents more detail for all states.) Our IMPLAN analyses indicate that these changes will reduce state GDPs by $197 billion in 2029, about 23 percent more than the federal savings due to funding cuts being magnified by the “multiplier effect.”
Overall, there will be 1.65 million fewer jobs in 2029 — almost half of which will be in health care — roughly equivalent to a 1.0 percentage point reduction in the national employment rate. State and local tax revenues will be more than $14 billion lower in 2029.
To illustrate relative losses, Exhibit 6 shows job losses as a percentage of state employment in the eight hardest-hit states, all of which have expanded Medicaid eligibility. The exhibit also highlights states with the largest number, rather than percentage, of jobs lost, ranging from 207,100 in California to 51,000 in Ohio.
Over the next decade, funding cuts and changes to Medicaid, the Supplemental Nutrition Assistance Program, and Affordable Care Act marketplaces through H.R. 1, and the expiration of the ACA enhanced premium tax credits, have the potential to reshape the U.S. economy and health system. The $50 billion funding increase through the Rural Health Transformation Program will not offset the much larger losses in health insurance coverage, decreased access to care, and increased hunger caused by H.R. 1 cuts.
We focused on two years in this brief: 2026, the first year of the law’s implementation, and 2029, when the law’s changes are fully implemented. Economic and employment impacts across states will also occur in 2027 and 2028, though those interim years are not presented here. By 2029, federal funding cuts will total $160 billion, triggering 1.65 million job losses. Slightly less than half of the jobs lost would be in health care, the leading sector for job growth in recent years.10 Research suggests these cuts also could reduce the capacity of hospitals and community health centers to provide care.11 The RHTP might offset a small portion of these losses through 2030, but it will be eclipsed by larger losses, particularly in urban areas where most Americans live. The economic repercussions of jobs lost in other areas, including grocery stores and food-related industries, will likely ripple to sectors such as retail, real estate, and construction across the nation.
Under H.R. 1, cuts to health and nutrition programs largely harm Americans with lower incomes, while tax cuts primarily benefit those with higher incomes. The CBO estimates that Americans in with lowest 10 percent of incomes will lose about $1,200 per year (3.1% of their incomes), while those with the top 10 percent of incomes will gain $13,600 per year (2.7% of their incomes).12 Other analyses reached similar conclusions.13
This brief illuminates another aspect of the budget cuts: how they harm state economies. While the budget cuts create $160 billion in savings for the federal government in 2029, state economic losses will outstrip those savings: we project state GDPs will decline by $197 billion, or about 23 percent more than the federal savings.
Cuts to Medicaid and SNAP will directly shift costs from the federal government to states. However, H.R. 1 will also lower state and local tax revenues by around $14 billion in 2029, making it harder for states to offset lost funds. Federal funding and tax revenue losses will likely force states to make further cuts to assistance programs and other public services like education. Though not directly required by H.R. 1, states could be forced to scale back programs such as home and community-based services for disabled and elderly populations.14
Proponents of the law explained that the budget cuts were intended to exclude “undeserving” populations from accessing benefits, such as able-bodied people who choose to not work, claiming these changes would ultimately help them gain jobs and incomes.15 But evidence indicates that work requirement programs do little to increase employment because they fail to address underlying reasons for unemployment.16 Moreover, by reducing the number of jobs in low-income communities, the new law could make it even harder for people to find jobs.
An important element of this analysis is estimating changes in federal funding for each state, based on the many sections of the bill. We began by estimating state “baseline” federal benefit expenditures for each state, using state estimates of Medicaid expenditures for fiscal year 2025 and actual SNAP expenditures for fiscal year 2024. These were then inflated to 2029 levels, based on Congressional Budget Office baselines, using data and methods described previously.17 For the Affordable Care Act marketplace, we used data about state-level ACA premium tax credits in 2024 and inflated these to 2026 and 2029 levels.
To estimate the reductions in federal funding that would occur at state levels we relied on the following sources:
Despite our efforts to use the best estimates available, we recognize that all projections are uncertain and that actual impacts may differ due to changing economic circumstances or state policy actions. Nonetheless, the analyses in this brief should provide conservative estimates of the approximate impact on federal funding levels and economic and employment effects.
Our estimates of the economic, employment, and tax effects of reduced federal funding are produced using IMPLAN, a widely used input-output economic impact software system.24 The underlying logic of our analyses is that funding changes have “multiplier effects” that are felt initially in the health care and food sectors but soon spread out to other economic and employment sectors as well.
IMPLAN enables us to estimate three key impacts for states, their businesses, and residents: 1) changes in state gross domestic products (GDPs) caused by the reduction in federal funding; 2) changes in the number of jobs in the state, which are categorized as direct (health or food), indirect (other sectors) and total employment; and 3) changes in state and local tax revenues caused by the changes in household and business incomes. The definitions of these metrics were described previously.25
For Medicaid, we partitioned each state’s Medicaid loss in four health care sectors: hospital, ambulatory care, pharmaceuticals, and long-term care, based on estimated Medicaid spending in these sectors.26 The analysis of ACA marketplace changes was similar, although it did not include the long-term care sector, which is not covered by ACA plans. Our IMPLAN-based analysis of the cuts in SNAP funding was similar but focused on changes in food-related expenditures. As described in an earlier brief, households must blend SNAP benefits and their own income to purchase enough food; research shows that SNAP induces a marginal propensity to purchase more food. Thus, we allocated each state’s share of SNAP reductions in two parts: a 30 percent reduction in food purchases and a 70 percent reduction in other consumer goods purchased by low-income households.
Data about the types of organizations that will receive RHTP funding within states is not yet known, although CMS issued some guidelines for states, such as no more than 10 percent allocated for administration.27 Using the IMPLAN industry categories, we allocated each state’s allocation into funding for state health departments, hospitals, and ambulatory health clinics. In many cases, allocations may initially go to nonprofit organizations or businesses to help with health care staffing or health information technology; in the end we expect that the funds will ultimately be received by health care organizations.
All these analyses use IMPLAN’s Multi-Region Input-Output (MRIO) methodology to account for cross-state effects of the policies (sometimes called “leakages”).28 For example, some of the food purchased in Georgia may have been grown in Kansas or processed in Tennessee, so lower grocery purchases in one state may trigger losses in other states. For example, a nurse who loses her job in a Louisiana clinic might reside in Texas; thus, a job lost in one state could create economic losses in another.
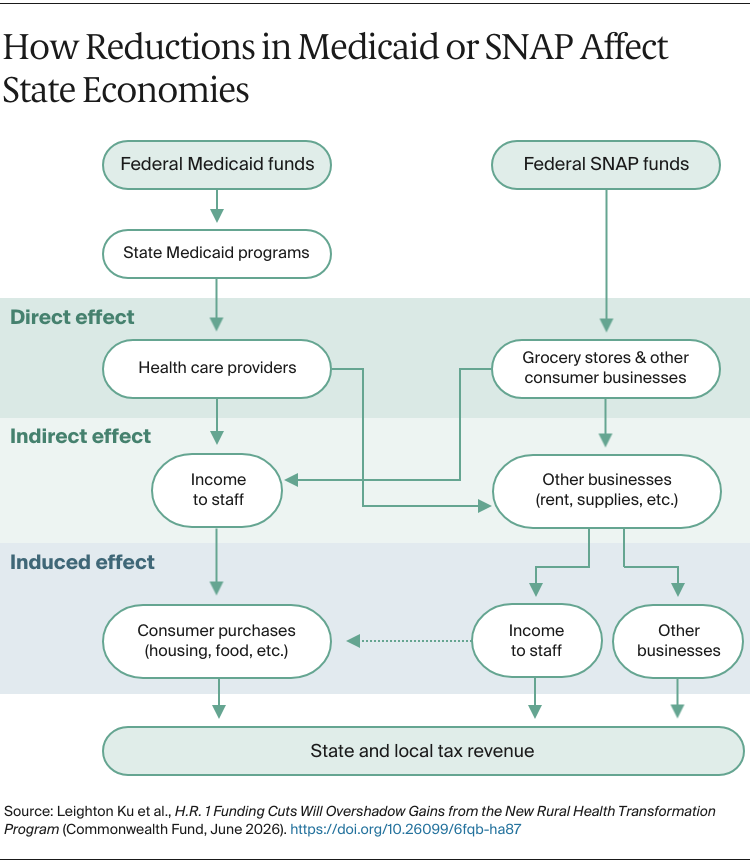
The figure below illustrates how the multiplier effect works for Medicaid and SNAP. For Medicaid, the reduction in federal Medicaid funds lead to reductions in state Medicaid programs’ budgets. In turn, the loss of insurance coverage lowers revenue to health care providers, like hospitals, clinics, pharmacies, and nursing homes. These are the direct effects.
In turn, health care providers must compensate for revenue losses by reducing how much they spend on staff and on goods and services from vendors (such as medical supplies, equipment, rent, and IT services). These businesses also must reduce spending on labor, goods, and services; the reductions in labor expenses means health providers and other businesses must lay off staff and reduce compensation. These are the indirect impacts of the policy change.
Finally, as employees lose income, they purchase fewer consumer goods and services (such as retail goods, transportation, groceries or rent). These are known as induced losses, which in turn lead to economic and employment losses. Falling personal and business income also lowers state and local revenue from income, sales, and other taxes, such as real estate taxes.
These principles also apply to the loss of federal SNAP funding. Although SNAP is administered by state agencies and benefits are distributed to recipients, the SNAP funds flow directly to grocery stores for food purchases, although as described above, economists recognize that consumers redeploy their available household income to purchase other goods and services. Parallel to the Medicaid example, these effects can be viewed as direct, indirect, and induced effects.
We focus on the effects of changes in federal funding because they are exogenous changes (“shocks”) in the resources available to each state and its residents caused solely by the federal policy changes. States, businesses, or individuals may compensate for the reduction in federal funding by shifting resources away from other uses (for example, cutting services or raising taxes) which have similar economic repercussions. Focusing on the federal budgetary changes makes our estimates more conservative. Also, some economic multiplier studies report the effects on a broader measure of economic activity, sometimes called output, which may double-count losses in production, wholesale, and retail sectors. We present estimates of changes in state GDPs, based on the value added (or lost) within a state; these are much more conservative and consistent with standard approaches for measuring state economies.
Medicaid, ACA, and SNAP cutbacks could have other harmful effects on health, nutrition, and well-being. A large body of research has demonstrated how the expansion of Medicaid coverage under the ACA led to improved health access, better health, and greater financial and mental well-being.29 SNAP has also been associated with better health and lower financial strain.30 For example, one report estimated H.R. 1 could cause medical debt to rise by as much as $50 billion,31 while another estimated 51,000 preventable deaths.32 The loss of health and nutrition benefits could impair health or mental well-being, leading to additional losses in productivity or higher health care costs. Our analyses do not account for these other health and social costs; they are based entirely on the economic repercussions of federal funding reductions on state economies and employment.
Publication Details
Date
Contact
Leighton Ku, Director, Center for Health Policy Research, Department of Health Policy and Management, Milken Institute School of Public Health, George Washington University
[email protected]

